

Question: Chapter 6 Problem 15 Using the financial statements provided below to answer the following questions: a. What was the book value of Novas shareholders equity
| Chapter 6 Problem 15 | ||||
| Using the financial statements provided below to answer the following questions: | ||||
| a. | What was the book value of Novas shareholders equity from 2015 to 2017? What were Novas debt-to-assets and times-interest-earned ratios in these years? (Use pretax income plus interest expense as EBIT.) What do these figures suggest about Novas use of financial leverage? Consulting Table 6-5 in the text, what bond rating would Nova have in 2016 if the rating were based solely on the firms coverage ratio? | |||
| b. | What percentage decline in EBIT could Nova have suffered in each year before Nova would have been unable to make its interest payments out of operating income? | |||
| c. | Assuming a 35 percent corporate tax rate, and 2016 earnings before interest and taxes of $895 million, by how much did Novas $60 million interest expense reduce taxes? | |||
| d. | Answer question (a) and (b) again for 2016 assuming the company had borrowed an additional $3 billion in debt at 8 percent interest at the start of the year and distributed the proceeds to shareholders as a special dividend. You may ignore the effect of added interest expense on Novas balance sheet. Might shareholders benefit from such an increase in financial leverage? Explain. | |||
| e. | Based on your analysis, is Nova heavily or modestly indebted? Should the company acquire more debt, or shed existing debt? Why?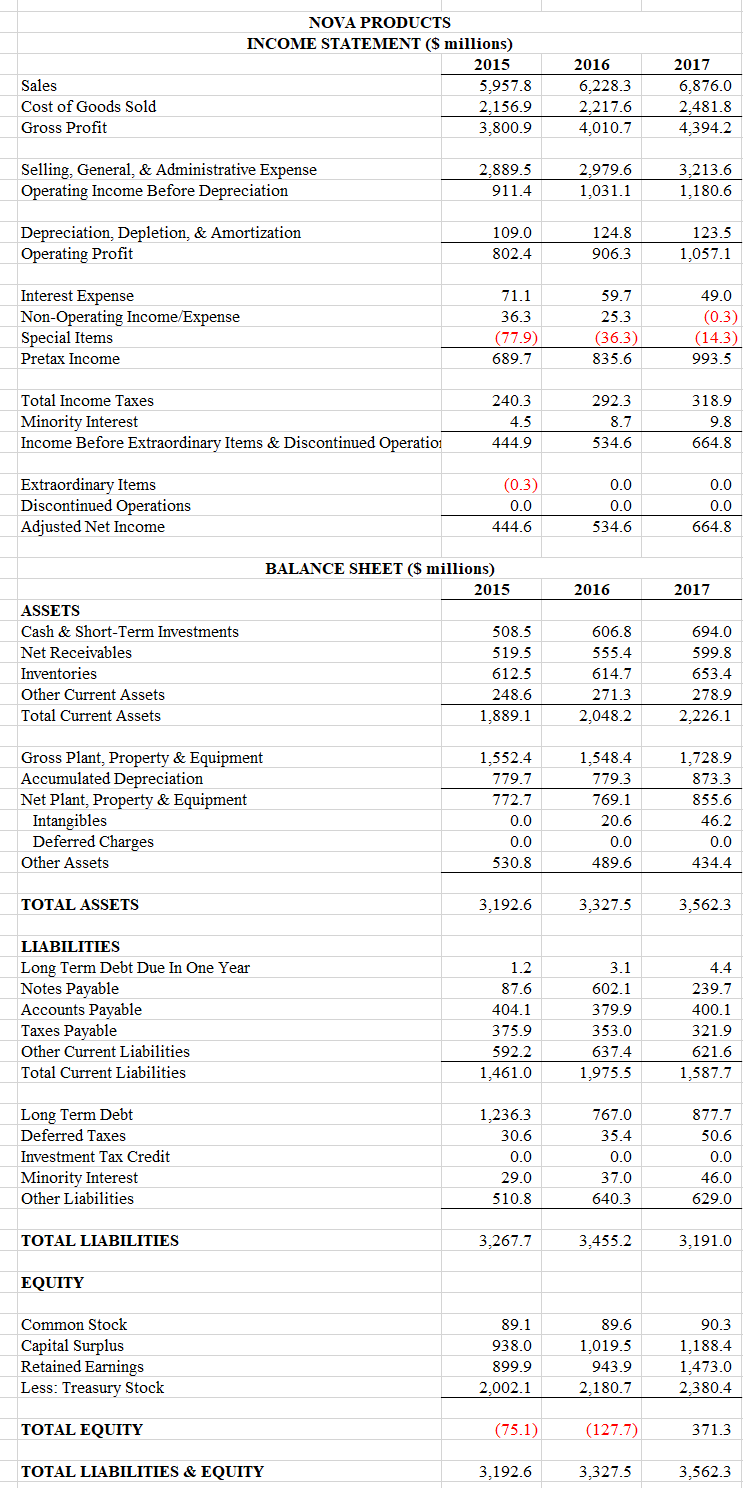 | |||
Sales Cost of Goods Sold Gross Profit Selling, General, & Administrative Expense Operating Income Before Depreciation Depreciation, Depletion, & Amortization Operating Profit Interest Expense Non-Operating Income/Expense Special Items Pretax Income Total Income Taxes Minority Interest Income Before Extraordinary Items & Discontinued Operation Extraordinary Items Discontinued Operations Adjusted Net Income ASSETS Cash & Short-Term Investments Net Receivables Inventories Other Current Assets Total Current Assets Gross Plant, Property & Equipment Accumulated Depreciation Net Plant, Property & Equipment Intangibles Deferred Charges Other Assets TOTAL ASSETS NOVA PRODUCTS INCOME STATEMENT ($ millions) 2015 LIABILITIES Long Term Debt Due In One Year Notes Payable Accounts Payable Taxes Payable Other Current Liabilities Total Current Liabilities Long Term Debt Deferred Taxes Investment Tax Credit Minority Interest Other Liabilities TOTAL LIABILITIES EQUITY Common Stock Capital Surplus Retained Earnings Less: Treasury Stock TOTAL EQUITY TOTAL LIABILITIES & EQUITY 5,957.8 2,156.9 3,800.9 2,889.5 911.4 109.0 802.4 71.1 36.3 (77.9) 689.7 240.3 4.5 444.9 (0.3) 0.0 444.6 BALANCE SHEET ($ millions) 2015 508.5 519.5 612.5 248.6 1,889.1 1,552.4 779.7 772.7 0.0 0.0 530.8 3,192.6 1.2 87.6 404.1 375.9 592.2 1,461.0 1,236.3 30.6 0.0 29.0 510.8 3,267.7 89.1 938.0 899.9 2,002.1 (75.1) 3,192.6 2016 6,228.3 2,217.6 4,010.7 2,979.6 1,031.1 124.8 906.3 59.7 25.3 (36.3) 835.6 292.3 8.7 534.6 0.0 0.0 534.6 2016 606.8 555.4 614.7 271.3 2,048.2 1,548.4 779.3 769.1 20.6 0.0 489.6 3,327.5 3.1 602.1 379.9 353.0 637.4 1,975.5 767.0 35.4 0.0 37.0 640.3 3,455.2 89.6 1,019.5 943.9 2,180.7 (127.7) 3,327.5 2017 6,876.0 2,481.8 4,394.2 3,213.6 1,180.6 123.5 1,057.1 49.0 (0.3) (14.3) 993.5 318.9 9.8 664.8 0.0 0.0 664.8 2017 694.0 599.8 653.4 278.9 2,226.1 1,728.9 873.3 855.6 46.2 0.0 434.4 3,562.3 4.4 239.7 400.1 321.9 621.6 1,587.7 877.7 50.6 0.0 46.0 629.0 3,191.0 90.3 1,188.4 1,473.0 2,380.4 371.3 3,562.3
Step by Step Solution
There are 3 Steps involved in it

Get step-by-step solutions from verified subject matter experts