

Question: Chapter 6 Problem 16 Below are the 2017 financial statements for Aquatic Supplies Co and the 5-year forecasts. (Be sure to enable iterative calculations to
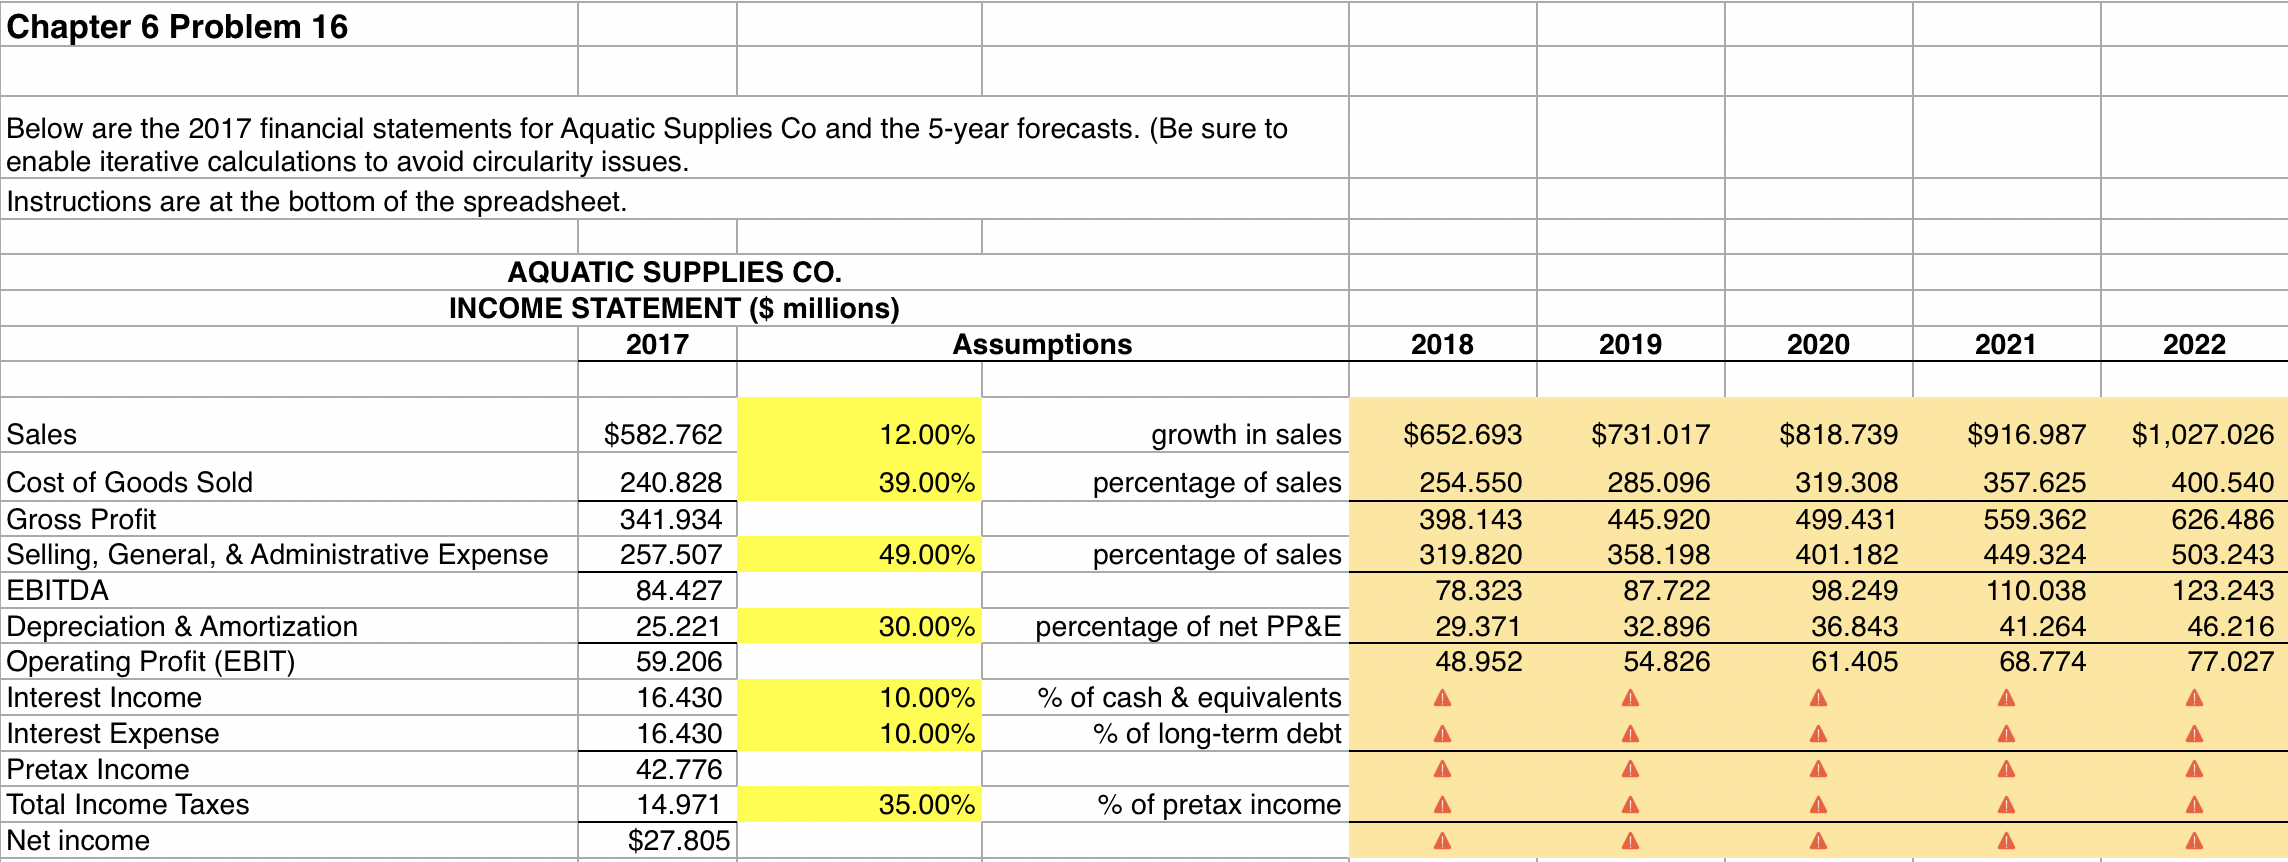
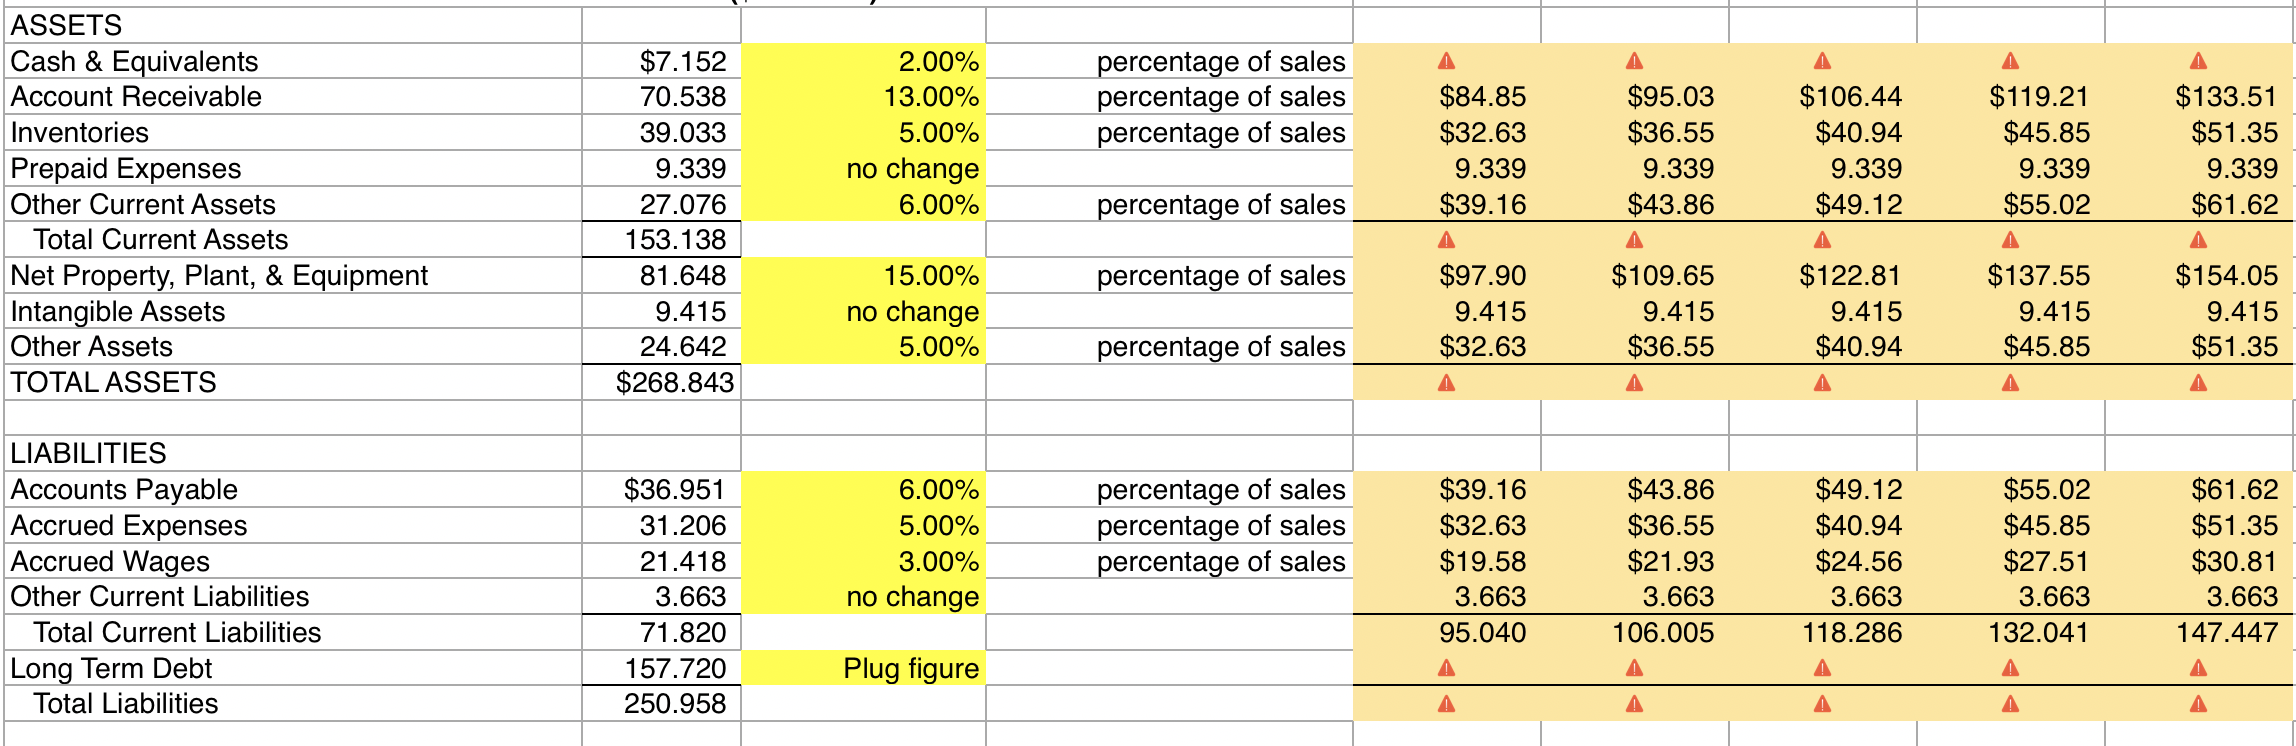
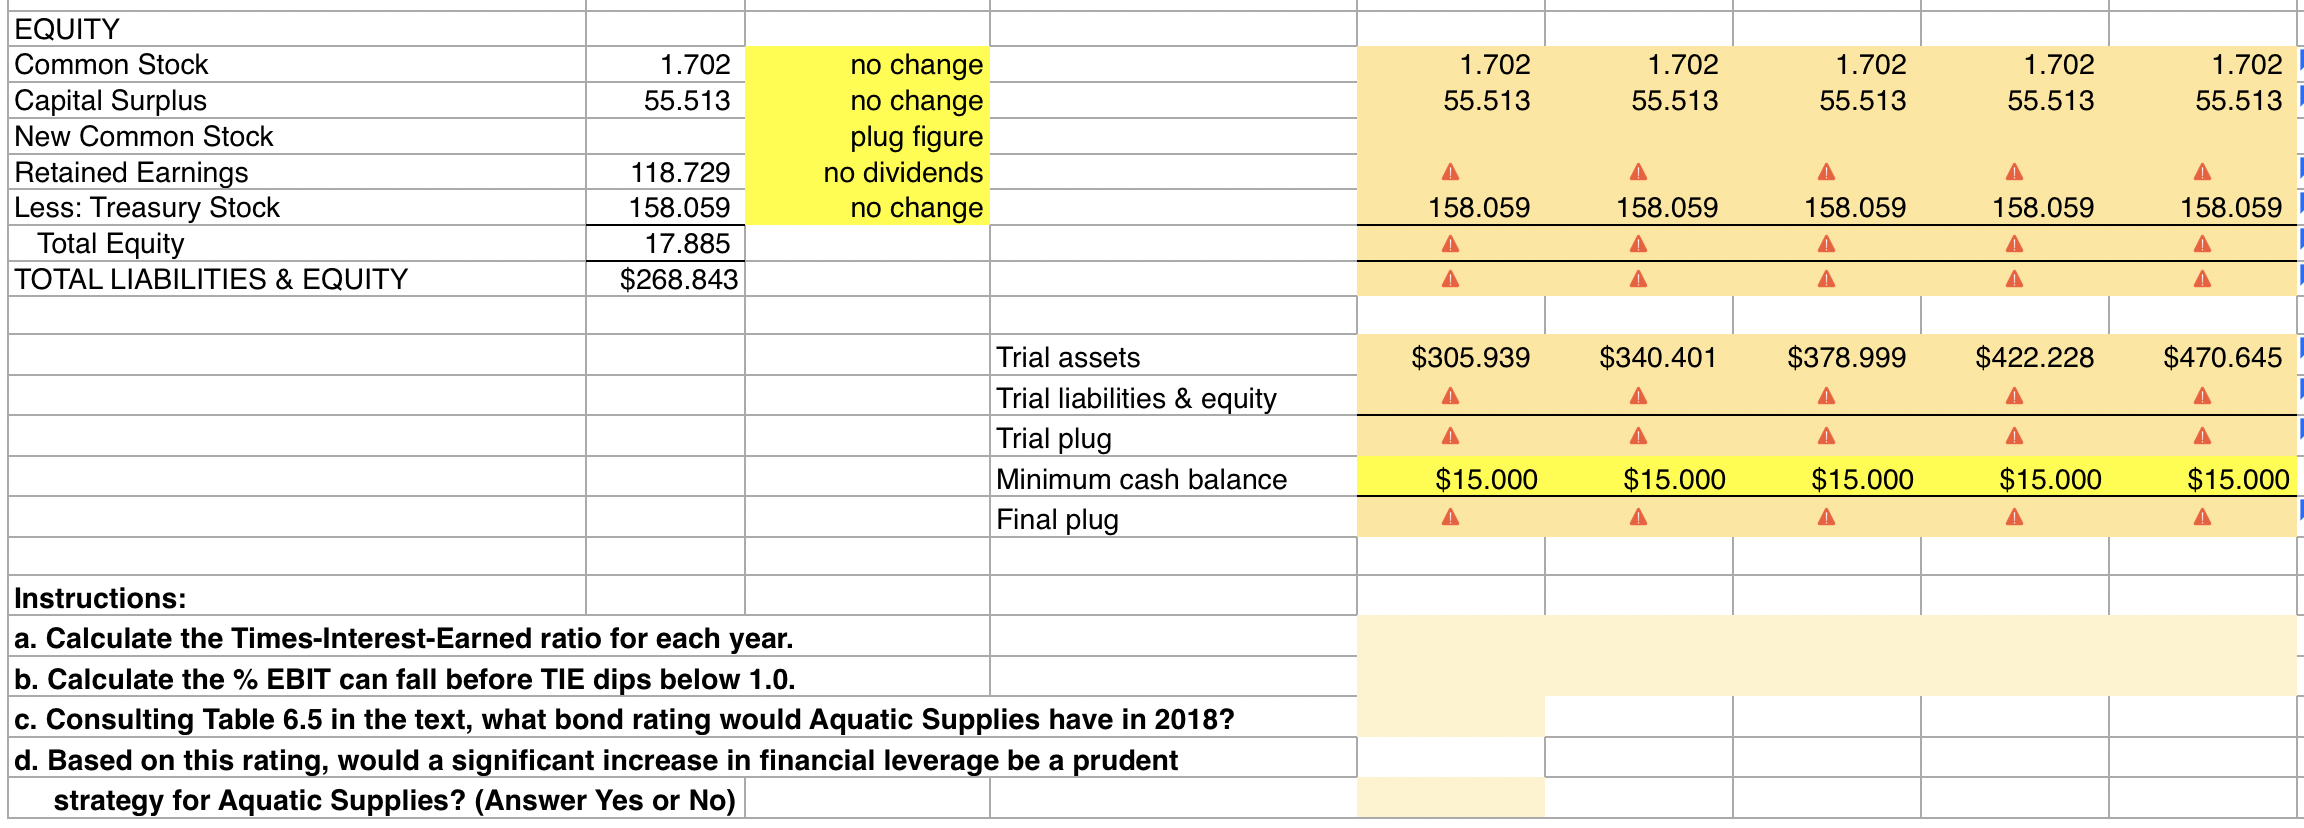
Chapter 6 Problem 16 Below are the 2017 financial statements for Aquatic Supplies Co and the 5-year forecasts. (Be sure to enable iterative calculations to avoid circularity issues. Instructions are at the bottom of the spreadsheet AQUATIC SUPPLIES CO. INCOME STATEMENT ($ millions) 2017 Assumptions 2018 2019 2020 2021 2022 $582.762 $818.739 12.00% 39.00% growth in sales percentage of sales 49.00% percentage of sales Sales Cost of Goods Sold Gross Profit Selling, General, & Administrative Expense EBITDA Depreciation & Amortization Operating Profit (EBIT) Interest Income Interest Expense Pretax Income Total Income Taxes Net income $652.693 254.550 398.143 319.820 78.323 29.371 48.952 $731.017 285.096 445.920 358.198 87.722 32.896 54.826 240.828 341.934 257.507 84.427 25.221 59.206 16.430 16.430 42.776 14.971 $27.805 319.308 499.431 401.182 98.249 36.843 61.405 $916.987 357.625 559.362 449.324 110.038 41.264 68.774 $1,027.026 400.540 626.486 503.243 123.243 46.216 77.027 30.00% percentage of net PP&E 10.00% 10.00% % of cash & equivalents % of long-term debt 35.00% % of pretax income ASSETS Cash & Equivalents Account Receivable Inventories Prepaid Expenses Other Current Assets Total Current Assets Net Property, Plant, & Equipment Intangible Assets Other Assets TOTAL ASSETS 2.00% 13.00% 5.00% no change 6.00% percentage of sales percentage of sales percentage of sales $84.85 $32.63 9.339 $39.16 $95.03 $36.55 9.339 $43.86 $106.44 $40.94 9.339 $49.12 $119.21 $45.85 9.339 $55.02 $133.51 $51.35 9.339 $61.62 percentage of sales $7.152 70.538 39.033 9.339 27.076 153.138 81.648 9.415 24.642 $268.843 percentage of sales 15.00% no change 5.00% $97.90 9.415 $32.63 $109.65 9.415 $36.55 $122.81 9.415 $40.94 $137.55 9.415 $45.85 $154.05 9.415 $51.35 percentage of sales LIABILITIES Accounts Payable Accrued Expenses Accrued Wages Other Current Liabilities Total Current Liabilities Long Term Debt Total Liabilities $36.951 31.206 21.418 3.663 71.820 157.720 250.958 6.00% 5.00% 3.00% no change percentage of sales percentage of sales percentage of sales $39.16 $32.63 $19.58 3.663 95.040 $43.86 $36.55 $21.93 3.663 106.005 $49.12 $40.94 $24.56 3.663 118.286 $55.02 $45.85 $27.51 3.663 132.041 $61.62 $51.35 $30.81 3.663 147.447 Plug figure 1.702 55.513 1.702 55.513 1.702 55.513 1.702 55.513 1.702 55.513 1.702 55.513 EQUITY Common Stock Capital Surplus New Common Stock Retained Earnings Less: Treasury Stock Total Equity TOTAL LIABILITIES & EQUITY no change no change plug figure no dividends no change 158.059 158.059 158.059 158.059 158.059 118.729 158.059 17.885 $268.843 1 A $305.939 $340.401 $378.999 $422.228 $470.645 Trial assets Trial liabilities & equity Trial plug Minimum cash balance Final plug $15.000 $15.000 $15.000 $15.000 $15.000 Instructions: a. Calculate the Times-Interest-Earned ratio for each year. b. Calculate the % EBIT can fall before TIE dips below 1.0. c. Consulting Table 6.5 in the text, what bond rating would Aquatic Supplies have in 2018? d. Based on this rating, would a significant increase in financial leverage be a prudent strategy for Aquatic Supplies? (Answer Yes or No)
Step by Step Solution
There are 3 Steps involved in it

Get step-by-step solutions from verified subject matter experts