

Question: Chapter 7 Managing interest Rate Risk GAP and Earnings Sens tivity 279 income Statement GAP With Rising Rates 1-Year Balance Sheet GAPECR $55,120,000 28,615,000 Rate
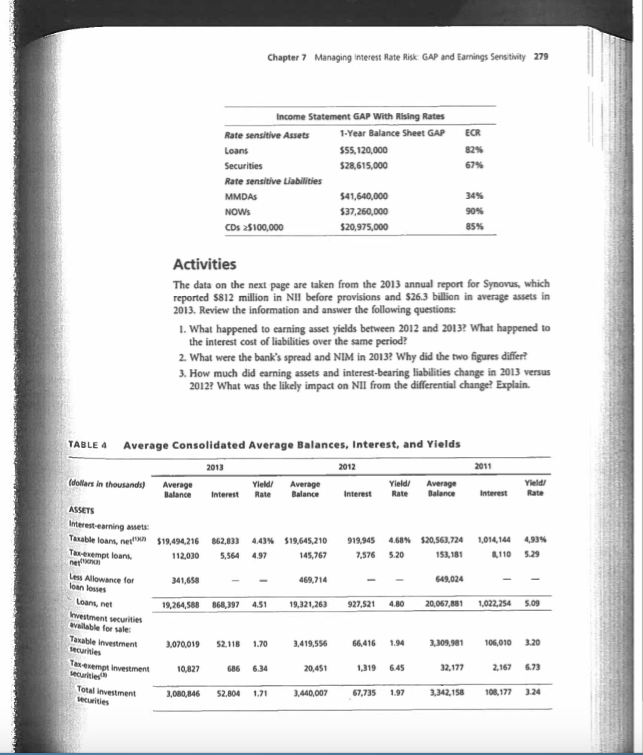
Chapter 7 Managing interest Rate Risk GAP and Earnings Sens tivity 279 income Statement GAP With Rising Rates 1-Year Balance Sheet GAPECR $55,120,000 28,615,000 Rate sensitive Assets Securities Rate sensitive Liabilities MMDAs 41,640,000 37,260,000 20,975,000 CDs 2$100,000 Activities The data on the next page are taken from the 2013 annual report for Synovus, which reported $812 million in NII before provisions and $26.3 billion in average assets in 2013. Review the information and answer the following questions I. What happened to earning asset yields between 2012 and 20132 What happened to the interest cost of liabilities over the same period? 2. What were the bank's spread and NIM in 20132 Why did the two igures differ? How much did earning assets and interest-bearing liabilities change in 2013 versus 2012? What was the likely impact on NII from the differential change? Explain. TABLE 4 Average Consolidated Average Balances, Interest, and Yields 2011 (dollars in thousands)Average AverageInterest Yield Average ate Balance Interest Rate Balance Interest Rate Balance Taxable loans, net'wn Tax-exempt loan, s2a56.724 53,181 1,014144493% 8 110 5.29 $19,494,216 862,033 4.43% $19,645,210 913345 4.68% 2030 564 4.9 145,767 ,576 5.20 Less Allowance for 341,658 469,714 Loans, net 19,264,588 868,397 45 19,321,263 927,521 4.80 20,067,881 1,022,254 $.09 available fer sale Taxable investment 3070,019 52118 1.70 419,556 66416 1.94 3,309,981 106,010 3.20 Tamempt investment 10,R27 686 634 20,45, 1,219 645 22,17, z19767, Total investment ,080,846 2,804 3,440,007 67,735 197 342,158 108,177 3.24 Chapter 7 Managing interest Rate Risk GAP and Earnings Sens tivity 279 income Statement GAP With Rising Rates 1-Year Balance Sheet GAPECR $55,120,000 28,615,000 Rate sensitive Assets Securities Rate sensitive Liabilities MMDAs 41,640,000 37,260,000 20,975,000 CDs 2$100,000 Activities The data on the next page are taken from the 2013 annual report for Synovus, which reported $812 million in NII before provisions and $26.3 billion in average assets in 2013. Review the information and answer the following questions I. What happened to earning asset yields between 2012 and 20132 What happened to the interest cost of liabilities over the same period? 2. What were the bank's spread and NIM in 20132 Why did the two igures differ? How much did earning assets and interest-bearing liabilities change in 2013 versus 2012? What was the likely impact on NII from the differential change? Explain. TABLE 4 Average Consolidated Average Balances, Interest, and Yields 2011 (dollars in thousands)Average AverageInterest Yield Average ate Balance Interest Rate Balance Interest Rate Balance Taxable loans, net'wn Tax-exempt loan, s2a56.724 53,181 1,014144493% 8 110 5.29 $19,494,216 862,033 4.43% $19,645,210 913345 4.68% 2030 564 4.9 145,767 ,576 5.20 Less Allowance for 341,658 469,714 Loans, net 19,264,588 868,397 45 19,321,263 927,521 4.80 20,067,881 1,022,254 $.09 available fer sale Taxable investment 3070,019 52118 1.70 419,556 66416 1.94 3,309,981 106,010 3.20 Tamempt investment 10,R27 686 634 20,45, 1,219 645 22,17, z19767, Total investment ,080,846 2,804 3,440,007 67,735 197 342,158 108,177 3.24
Step by Step Solution
There are 3 Steps involved in it

Get step-by-step solutions from verified subject matter experts