

Question: Chapter 8 - Activity 2 : PLEASE NOTE I Dont have access to excel so please do not send answers for me to reference excel
Chapter
Activity
: PLEASE NOTE I Dont have access to excel so please do not send answers for me to reference excel I need straighforward answers. A few I have already answered but stuck on part B
Many thanks!!!
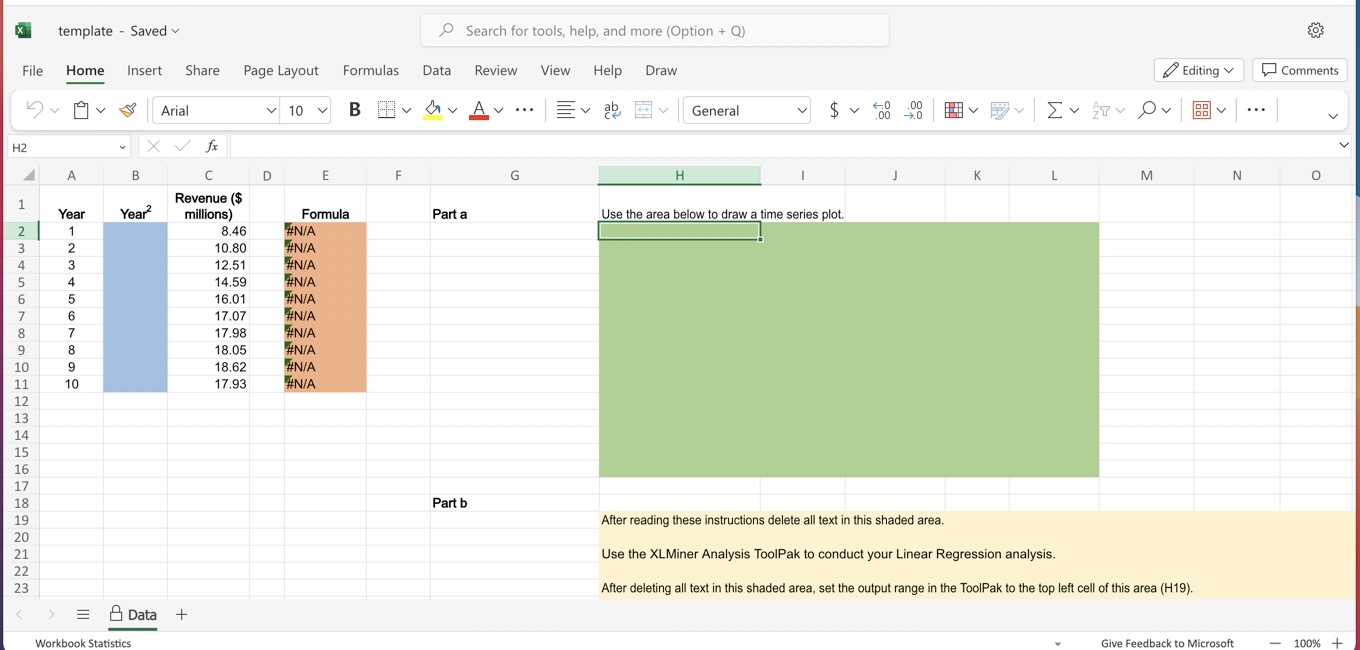
Giovanni Food Products produces and sells frozen pizzas to public schools throughout the eastern United States. Using a very aggressive marketing strategy they have been able to increase their annual revenue by approximately $
million over the past
years But increased competition has slowed their growth rate in the past few years. The annual revenue, in millions of dollars, for the previous
years is contained in the Excel Online file below. Construct a spreadsheet to answer the following questions.
Due to a recent change by Microsoft you will need to open the XLMiner Analysis ToolPak add
in manually from the home ribbon. Screenshot of ToolPak
Open spreadsheet
Choose the correct time series plot for the data.
A
B
C
D
The correct time series plot is
plot B
Comment on the appropriateness of a linear trend.
A linear trend is not appropriate
Develop a quadratic trend equation that can be used to forecast revenue
to
decimals
Using the trend equation developed in part
b
forecast revenue in year
to
decimals
Excel Chart:
Year Year
Revenue
$ millions
The correct time series plot is plot B
Comment on the appropriateness of a linear trend.
A linear trend is not appropriate
b Develop a quadratic trend equation that can be used to forecast revenue to decimals
:
:
:
c Using the trend equation developed in part b forecast revenue in year to decimals
After reading these instructions delete all text in this shaded area.
Use the XLMiner Analysis ToolPak to conduct your Linear Regression analysis.
After deleting all text in this shaded area, set the output range in the ToolPak to the top left cell of this area H
Step by Step Solution
There are 3 Steps involved in it
1 Expert Approved Answer
Step: 1 Unlock

Question Has Been Solved by an Expert!
Get step-by-step solutions from verified subject matter experts
Step: 2 Unlock
Step: 3 Unlock