Question: Chapter 8 Data Case You have just been hired by Internal Business Machines Corporation (IBM) in their capital budgeting division. Your first assignment is to
Chapter 8 Data Case
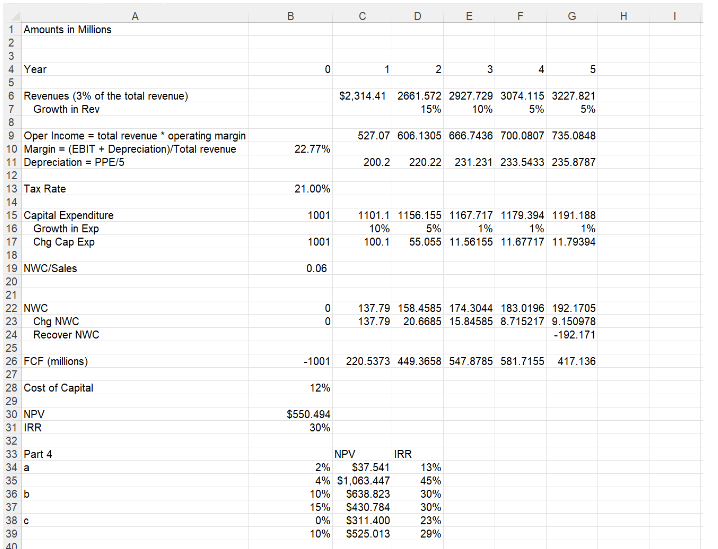
You have just been hired by Internal Business Machines Corporation (IBM) in their capital budgeting division. Your first assignment is to determine the free cash flows and NPV of a proposed new type of tablet computer similar in size to an iPad but with the operating power of a high-end desktop system.
Development of the new system will initially requirean initial capital expenditure equal to 10% of IBM's Net Property, Plant, and Equipment (PPE) at the end of the latest fiscal year for which data is available. The project will then require an additional investment equal to 10% of the initial investment after the first year of the project, a 5% increase after the second year, and a 1% increase after the third, fourth, and fifth years. The product is expected to have a life of five years. First-year revenues for the new product are expected to be3% of IBM's total revenue for the latest fiscal year for which data is available. The new product's revenues are expected to grow at 15% for the second year then 10% for the third and 5% annually for the final two years of the expected life of the project. Your job is to determine the rest of the cash flows associated with this project. Your boss has indicated that the operating costs and net working capital requirements are similar to the rest of the company (implying the project will have the same ratio of EBITDA to sales and working capital to sales) and that depreciation is straight-line (over 5 years) for capital budgeting purposes.
Since your boss hasn't been much help (welcome to the "real world"!), here are some tips to guide your analysis:
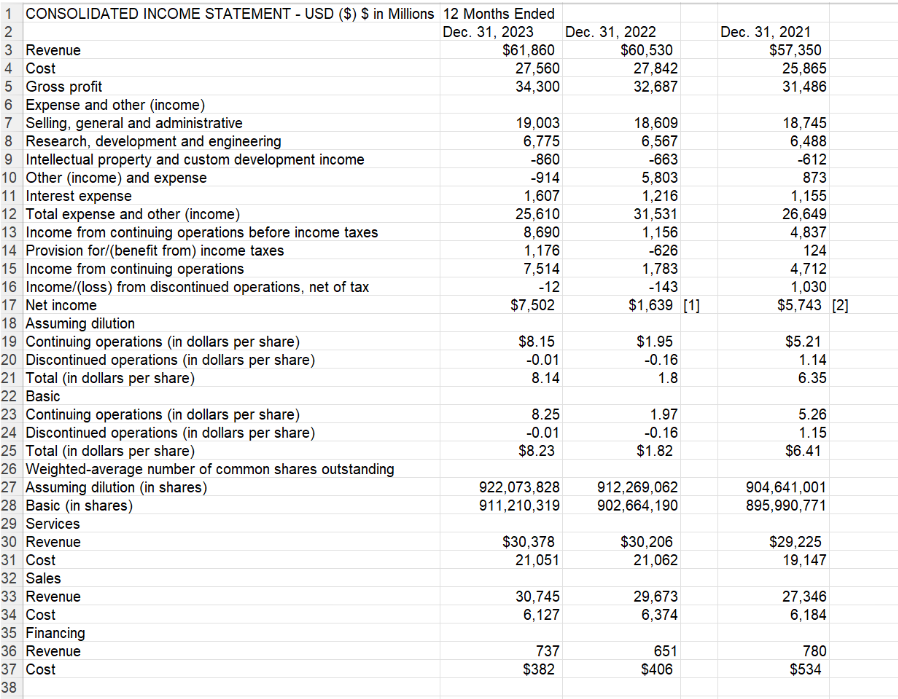
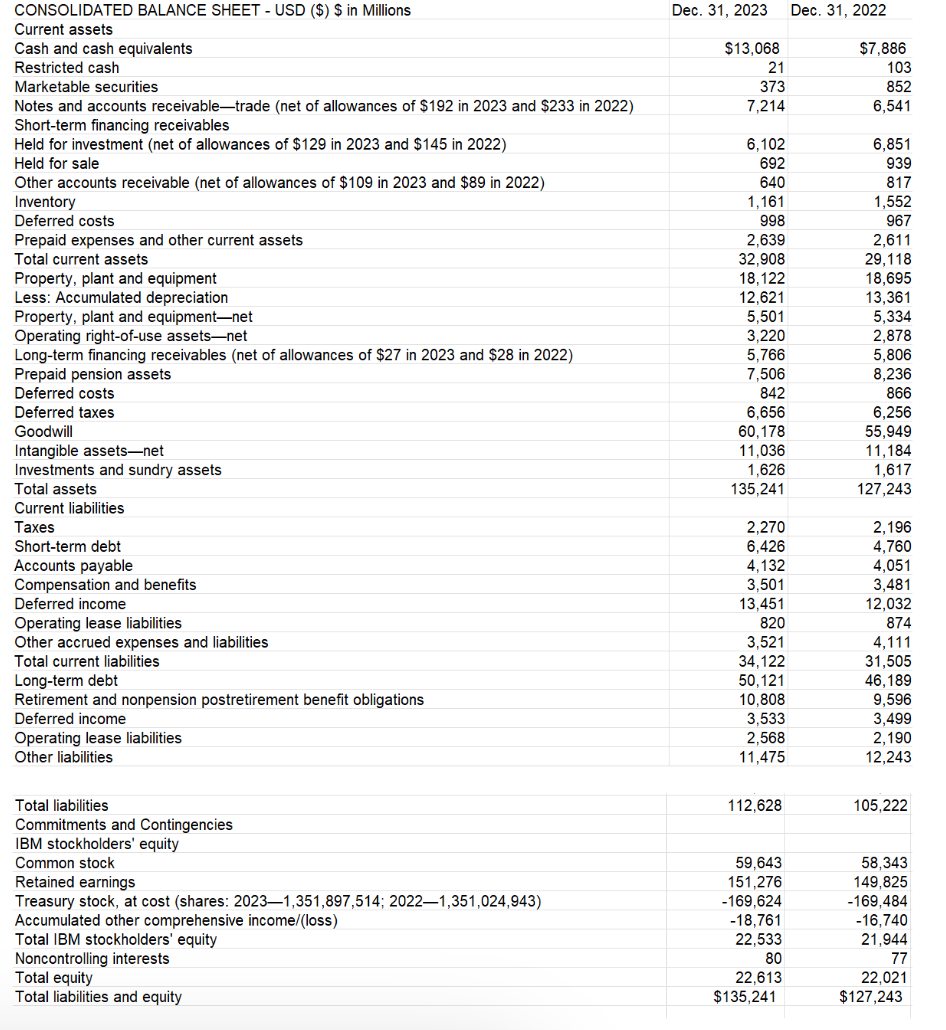
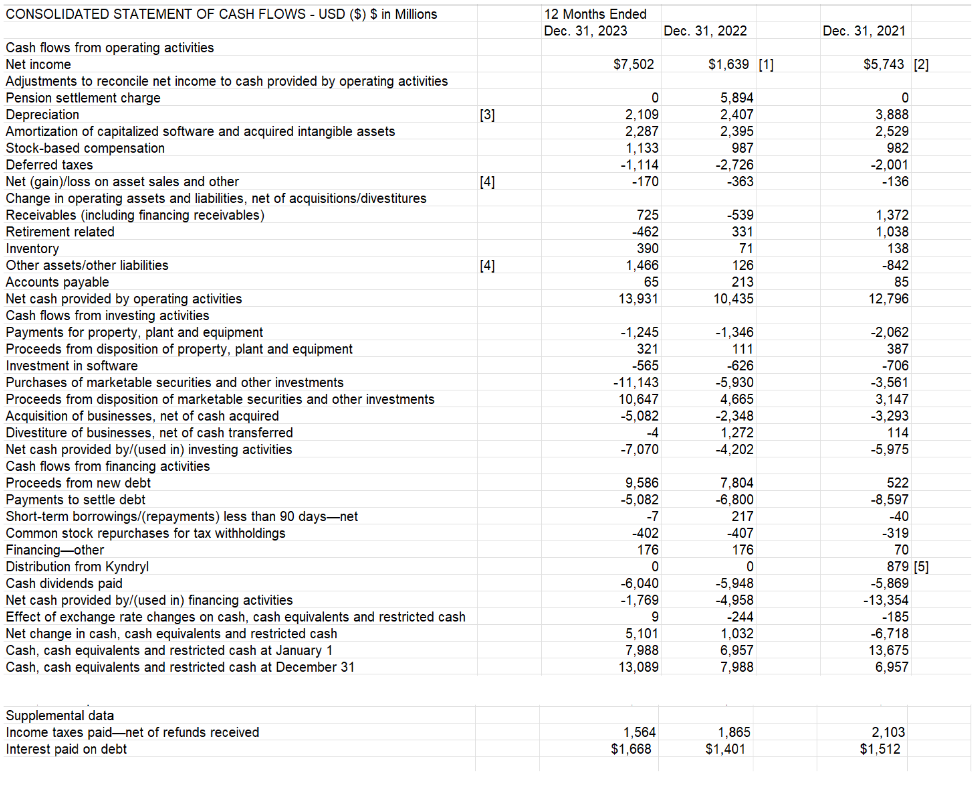
1. Obtain IBM's financial statements: see attached. (Only income, balance sheet, and cash flows needed)
CONSOLIDATED INCOME STATEMENT - USD ($) $ in Millions 12 Months Ended Revenue Cost Gross profit Expense and other (income) Selling, general and administrative Research, development and engineering Intellectual property and custom development income Other (income) and expense Interest expense Total expense and other (income) Income from continuing operations before income taxes Provision for/(benefit from) income taxes Income from continuing operations Income/(loss) from discontinued operations, net of tax Net income Assuming dilution Continuing operations (in dollars per share) Discontinued operations (in dollars per share) Total (in dollars per share) Basic Continuing operations (in dollars per share) Discontinued operations (in dollars per share) Total (in dollars per share) Weighted-average number of common shares outstanding Assuming dilution (in shares) Basic (in shares) Services Revenue Cost Sales Revenue Cost Financing Revenue Cost Dec. 31, 2023 $61,860 27,560 34,300 19,003 6,775 -860 -814 1,607 25,610 8,690 1,178 7.514 -12 $7,502 $8.15 -0.01 8.14 8.25 -0.01 $8.23 922,073,828 911,210,318 $30,378 21,051 30,745 6,127 737 $382 Dec. 31, 2022 $60,530 27,842 32,687 18,609 6,567 -663 5,803 1,216 31,531 1,156 -526 1,783 143 $1,639 [1] $1.85 -0.186 1.8 1.97 -0.18 $1.82 912,269,062 902,664,190 $30.206 21,062 20,673 6,374 651 5406 Dec. 31, 2021 357,350 25,865 31,486 18,745 6,488 -612 873 1,155 26,649 4,837 124 4,712 1,030 $5,743 [2] $5.21 1.14 6.35 5.26 1.15 $6.41 904,641,001 885,990,771 $29,225 19,147 27,346 6,184 780 $534 CONSOLIDATED BALANCE SHEET - USD ($) $ in Millions Current assets Cash and cash equivalents Restricted cash Marketable securities Notes and accounts receivabletrade (net of allowances of $192 in 2023 and 3233 in 2022) Short-term financing receivables Held for investment (net of allowances of $129 in 2023 and $145 in 2022) Held for sale Other accounts receivable (net of allowances of $109 in 2023 and $89 in 2022) Inventory Deferred costs Prepaid expenses and other current assets Total current assets Property, plant and equipment Less: Accumulated depreciation Property, plant and equipmentnet Operating right-of-use assetsnet Long-term financing receivables (net of allowances of $27 in 2023 and $28 in 2022) Prepaid pension assets Deferred costs Deferred taxes Goodwill Intangible assetsnet Investments and sundry assets Total assets Current liabilities Taxes Short-term debt Accounts payable Compensation and benefits Deferred income Operating lease liabilities Other accrued expenses and liabilities Total current liabilities Long-term debt Retirement and nonpension postretirement benefit obligations Deferred income Operating lease liabilities Other liabilities Total liabilities Commitments and Contingencies |BM stockholders' equity Common stock Retained earnings Treasury stock, at cost (shares: 20231,351,887,514,; 20221,351,024,943) Accumulated other comprehensive income/(loss) Total IBM stockholders' equity Noncontrolling interests Total equity Total liabilities and equity Dec. 31, 2023 $13,068 21 373 7,214 6,102 692 640 1,161 998 2,639 32,908 18,122 12,621 5,501 3,220 5,766 7,506 842 6,656 60,178 11,036 1,626 135,241 2,270 6,426 4,132 3,501 13,451 820 3,521 34,122 50,121 10,808 3,533 2,568 11,475 112,628 59,643 151,276 -169,624 -18,761 22,533 80 22,613 $135,241 Dec. 31, 2022 $7,886 103 852 6,541 6,851 939 817 1,552 967 2,611 28,118 18,695 13,361 5,334 2,878 5,806 8,236 866 6,256 55,949 11,184 1,617 127,243 2,196 4,760 4,051 3,481 12,032 874 4,111 31,505 46,189 9,596 3,499 2,180 12,243 105,222 58,343 149,825 -169,484 -16,740 21,944 77 22,021 $127,243 CONSOLIDATED STATEMENT OF CASH FLOWS - USD ($) in Milliens Cash flows from operating activities Net income Adjustments to reconcile net income to cash provided by operating activities Pension settlement charge Depreciation Amortization of capitalized software and acquired intangible assets Stock-based compensation Deferred taxes Net (gain)/loss on asset sales and other Change in operating assets and liabilities, net of acquisitions/divestitures Receivables (including financing receivables) Retirement related Inventory Other assets/other liabilities Accounts payable Net cash provided by operating activities Cash flows from investing activities Payments for property, plant and equipment Proceeds from disposition of property, plant and equipment Investment in software Purchases of marketable securities and other investments Proceeds from disposition of marketable securities and other investments Acquisition of businesses, net of cash acquired Divestiture of businesses, net of cash transferred Net cash provided by/{used in) investing activities Cash flows from financing activities Proceeds from new debt Payments to settle debt Short-term borrowings/(repayments) less than 90 daysnet Common stock repurchases for tax withholdings Financingother Distribution from Kyndryl Cash dividends paid Net cash provided by/(used in) financing activities Effect of exchange rate changes on cash, cash equivalents and restricted cash Net change in cash, cash equivalents and restricted cash Cash, cash equivalents and restricted cash at January 1 Cash, cash equivalents and restricted cash at December 31 Supplemental data Income taxes paidnet of refunds received Interest paid on debt (3] 4] [4] 12 Months Ended Dec. 31, 2023 $7,502 0 2,109 2,287 1,133 -1,114 170 725 -462 390 1,466 65 13,931 -1,245 321 -565 11,143 10,847 -5,082 4 -7.070 9,586 -5,082 7 -402 176 0 6,040 -1,769 9 5.101 7,988 13,089 1,564 $1,668 Dec. 31, 2022 $1,639 [1] 5,894 2,407 2,395 987 -2,726 -363 -538 331 7 126 213 10,435 -1,346 11 .626 -5.930 4,665 -2,348 1,272 -4,202 7,804 -6.800 217 -407 176 0 -5,948 -4,958 -244 1,032 6,957 7,988 1,865 $1.401 Dec. 31, 2021 $5,743 [2] 0 3.888 2,529 982 -2,001 -136 1,372 1,038 138 -842 85 12,796 -2,082 387 -706 -3.561 3.147 -3,293 114 -5,975 522 -8,597 -40 -319 70 879 [5] -5.869 -13,354 -185 6718 13,675 6,957 2,103 $1,512 A B C D F F G H Amounts in Millions Year 0 2 3 4 5 Revenues (3% of the total revenue) $2,314.41 2661.572 2927.729 3074.115 3227.821 Growth in Rev 15% 10% 5% 5% Oper Income = total revenue * operating margin 527.07 606.1305 666.7436 700.0807 735.0848 10 Margin = (EBIT + Depreciation)/Total revenue 22.77% 11 Depreciation = PPE/5 200.2 220.22 231.231 233.5433 235.8787 12 13 Tax Rate 21.00% 14 15 Capital Expenditure 1001 1101.1 1156.155 1167.717 1179.394 1191.188 16 Growth in Exp 10% 5% 1% 1% 1% 17 Chg Cap Exp 1001 100.1 55.055 11.56155 11.67717 11.79394 18 19 NWC/Sales 0.06 20 21 22 NWC 137.79 158.4585 174.3044 183.0196 192.1705 23 Chg NWC 137.79 20.6685 15.84585 8.715217 9.150978 24 Recover NWC -192.171 25 26 FCF (millions) -1001 220.5373 449.3658 547 8785 581.7155 417.136 27 28 Cost of Capital 12% 29 30 NPV $550.494 31 IRR 30% 32 33 Part 4 NPV IRR 34 a 2% $37.541 13% 35 4% $1,063.447 45% 36 b 10% 5638.823 30% 37 15% 5430.784 30% 38 c 0% $311.400 23% 39 10% $525.013 29%
Step by Step Solution
There are 3 Steps involved in it
1 Expert Approved Answer
Step: 1 Unlock
Question Has Been Solved by an Expert!
Get step-by-step solutions from verified subject matter experts
Step: 2 Unlock
Step: 3 Unlock
Students Have Also Explored These Related Finance Questions!