

Question: Chapter 8 Exercises: P 8 - 4 Given the survey data shown in Figure P 8 - 4 , establish contour lines at a 5
Chapter Exercises: P
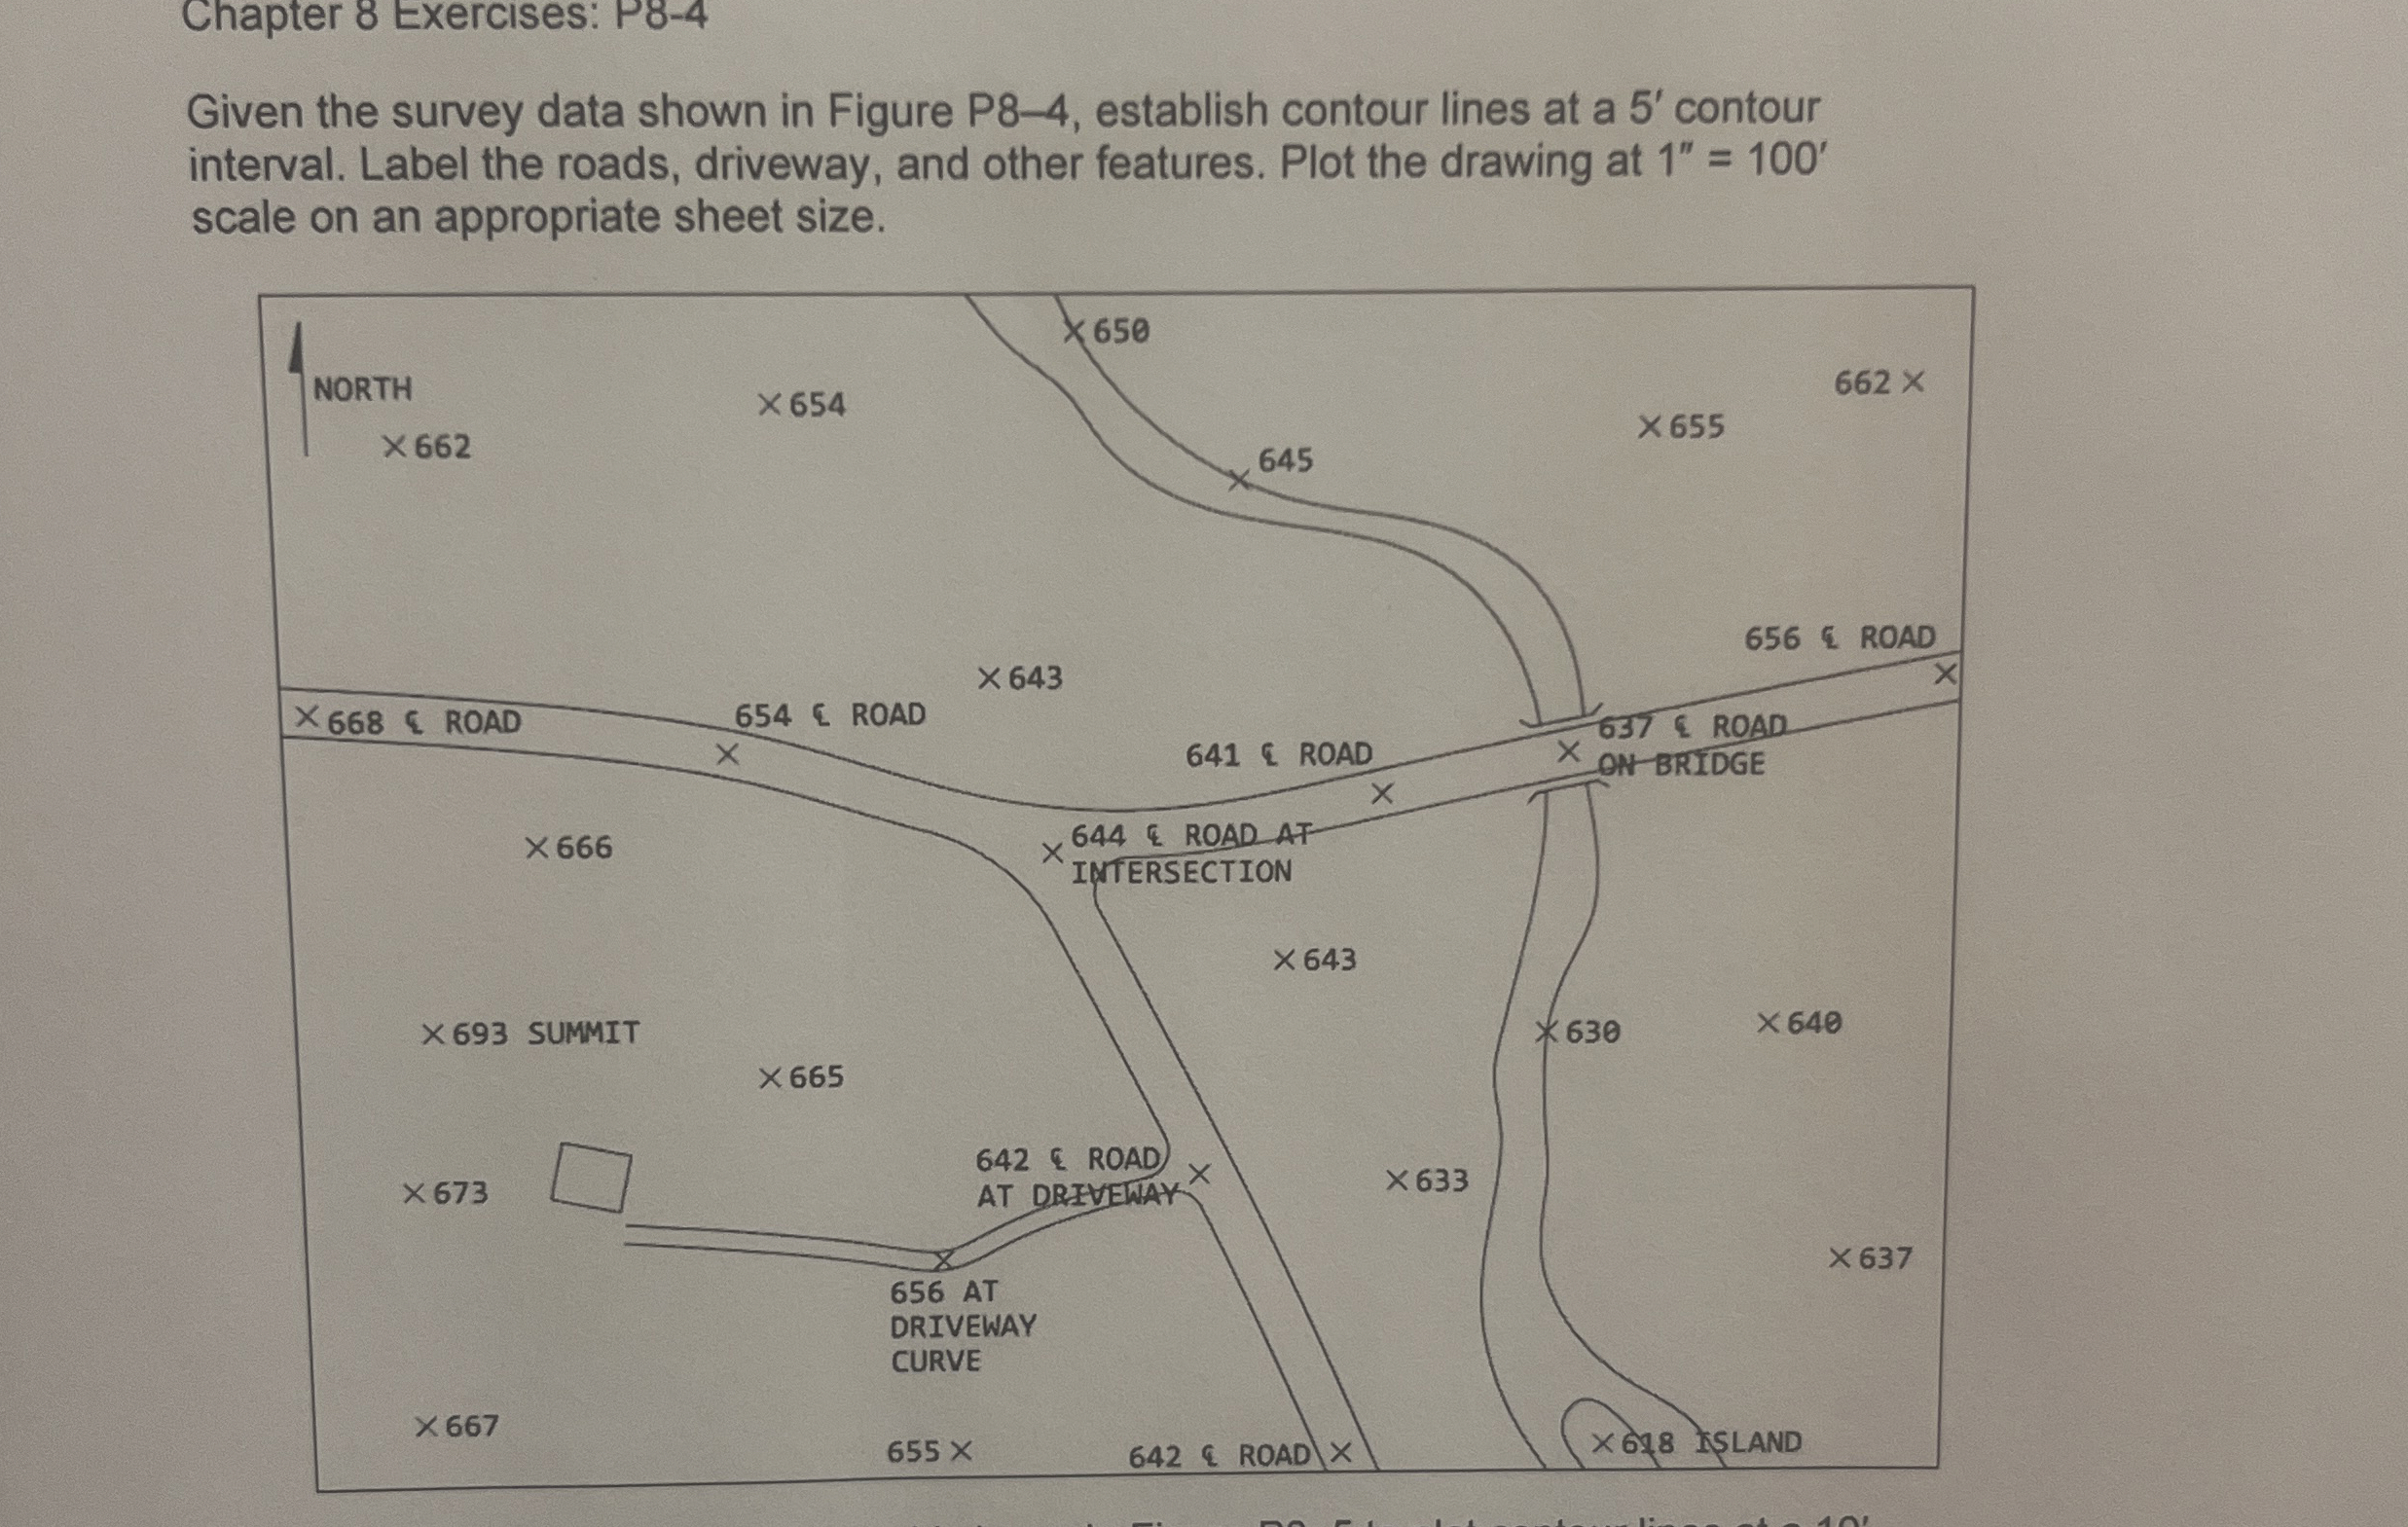
Given the survey data shown in Figure P establish contour lines at a contour interval. Label the roads, driveway, and other features. Plot the drawing at scale on an appropriate sheet size.
Step by Step Solution
There are 3 Steps involved in it
1 Expert Approved Answer
Step: 1 Unlock

Question Has Been Solved by an Expert!
Get step-by-step solutions from verified subject matter experts
Step: 2 Unlock
Step: 3 Unlock