

Question: Chapter 8, Question 8-64 in the Textbook. Consider this EER diagram. Let's make the following assumptions: There are 14,000,000 customers. These customers have altogether 50,000,000
Chapter 8, Question 8-64 in the Textbook.
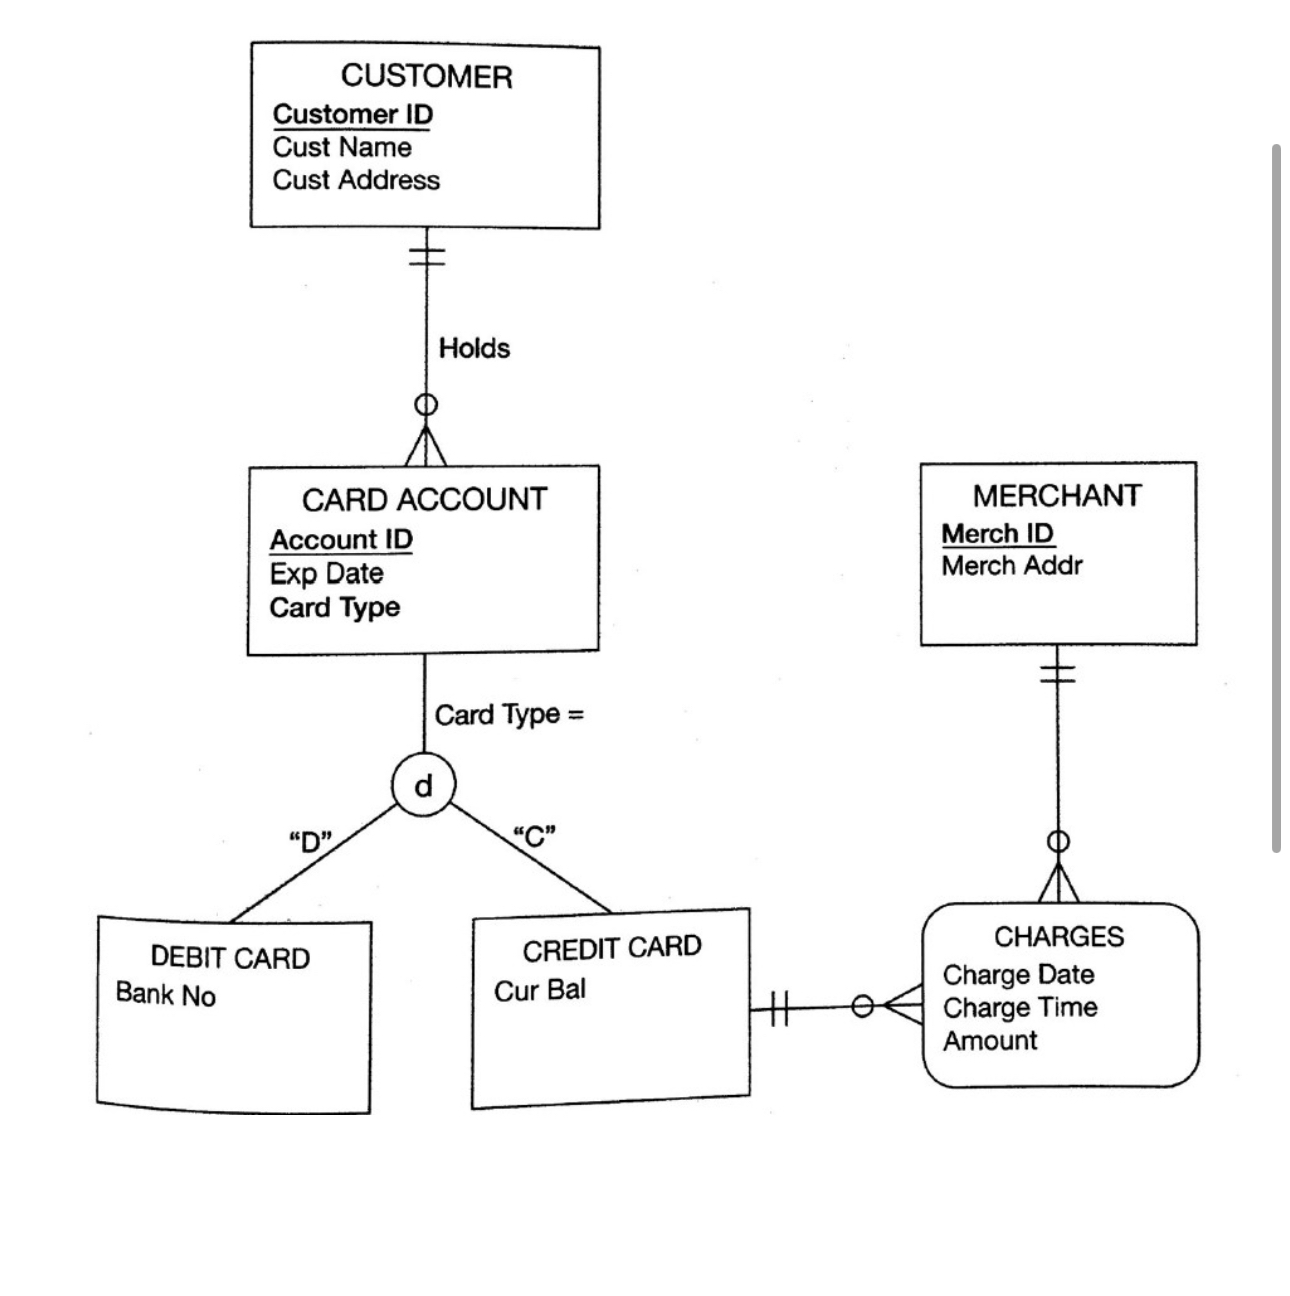
Consider this EER diagram.
 Let's make the following assumptions:
There are 14,000,000 customers.
These customers have altogether 50,000,000 card accounts. Of these, 75 percent are credit card accounts and 25 percent debit card accounts.
There are 3,500,000 merchants who accept these cards.
There are, on average, 35 charges per merchant per day. The range is very large.
Customers are making, on average, 2,500,000 requests per day to view their account balances and transactions.
Merchants are making, on average, 6,000,000 requests per day to view the transactions they have submitted to the bank.
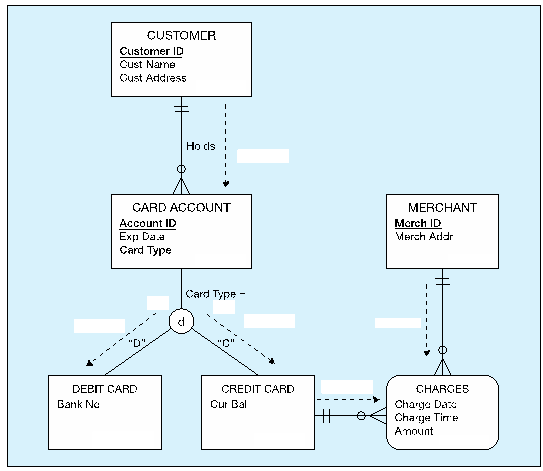
1. Based on these assumptions, draw a usage map for this portion of the EER diagram. You can complete this usage map or create a new one:
b. What opportunities for denormalization can you identify in this case (if any)?
Step by Step Solution
There are 3 Steps involved in it

Get step-by-step solutions from verified subject matter experts