

Question: Chapter: Correlation and Causality Question: Consider the following data on violent crime rate (measured in violent crimes reported per 100,000 people in the population) and
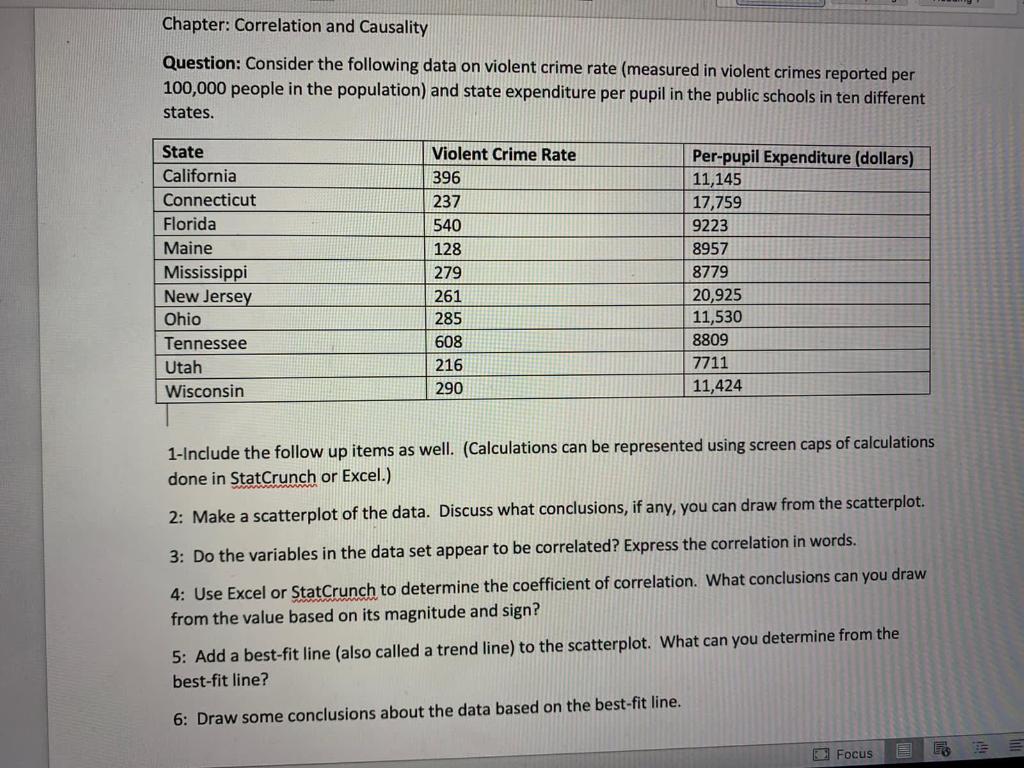
Chapter: Correlation and Causality Question: Consider the following data on violent crime rate (measured in violent crimes reported per 100,000 people in the population) and state expenditure per pupil in the public schools in ten different states. State Violent Crime Rate 396 237 California Connecticut Florida Maine Mississippi New Jersey Ohio Tennessee Utah Wisconsin 540 128 279 261 285 608 216 290 Per-pupil Expenditure (dollars) 11,145 17,759 9223 8957 8779 20,925 11,530 8809 7711 11,424 1-Include the follow up items as well. (Calculations can be represented using screen caps of calculations done in StatCrunch or Excel.) 2: Make a scatterplot of the data. Discuss what conclusions, if any, you can draw from the scatterplot. 3: Do the variables in the data set appear to be correlated? Express the correlation in words. 4: Use Excel or StatCrunch to determine the coefficient of correlation. What conclusions can you draw from the value based on its magnitude and sign? 5: Add a best-fit line (also called a trend line) to the scatterplot. What can you determine from the best-fit line? 6: Draw some conclusions about the data based on the best-fit line. Focus Chapter: Correlation and Causality Question: Consider the following data on violent crime rate (measured in violent crimes reported per 100,000 people in the population) and state expenditure per pupil in the public schools in ten different states. State Violent Crime Rate 396 237 California Connecticut Florida Maine Mississippi New Jersey Ohio Tennessee Utah Wisconsin 540 128 279 261 285 608 216 290 Per-pupil Expenditure (dollars) 11,145 17,759 9223 8957 8779 20,925 11,530 8809 7711 11,424 1-Include the follow up items as well. (Calculations can be represented using screen caps of calculations done in StatCrunch or Excel.) 2: Make a scatterplot of the data. Discuss what conclusions, if any, you can draw from the scatterplot. 3: Do the variables in the data set appear to be correlated? Express the correlation in words. 4: Use Excel or StatCrunch to determine the coefficient of correlation. What conclusions can you draw from the value based on its magnitude and sign? 5: Add a best-fit line (also called a trend line) to the scatterplot. What can you determine from the best-fit line? 6: Draw some conclusions about the data based on the best-fit line. Focus
Step by Step Solution
There are 3 Steps involved in it

Get step-by-step solutions from verified subject matter experts