

Question: Chapter Numerical Descriptive Measures of Data Please help me with explanation. a) The following table shows information scored by students in their Statistics examination. Minimum
Chapter Numerical Descriptive Measures of Data
Please help me with explanation.
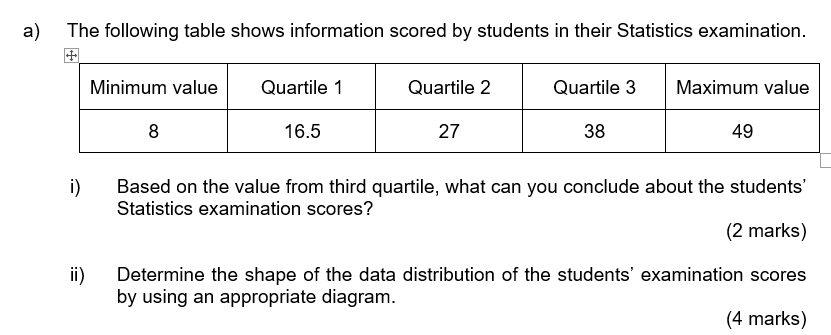
a) The following table shows information scored by students in their Statistics examination. Minimum value Quartile 1 Quartile 2 Quartile 3 Maximum value 8 16.5 27 38 49 Based on the value from third quartile, what can you conclude about the students' Statistics examination scores? (2 marks) ii) Determine the shape of the data distribution of the students' examination scores by using an appropriate diagram. (4 marks)
Step by Step Solution
There are 3 Steps involved in it
1 Expert Approved Answer
Step: 1 Unlock

Question Has Been Solved by an Expert!
Get step-by-step solutions from verified subject matter experts
Step: 2 Unlock
Step: 3 Unlock