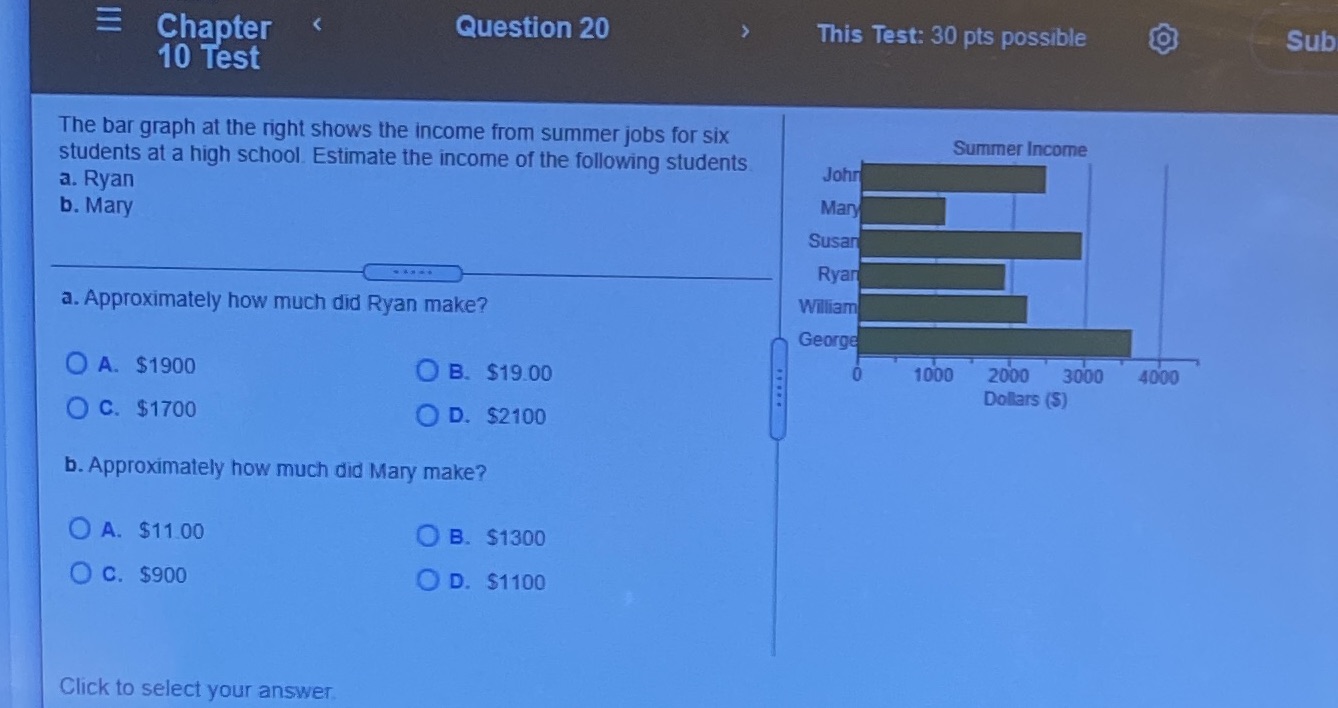
Question: Chapter Question 20 This Test: 30 pts possible Sub 10 Test The bar graph at the right shows the income from summer jobs for six

Chapter Question 20 This Test: 30 pts possible
Chapter Question 20 This Test: 30 pts possible Sub 10 Test The bar graph at the right shows the income from summer jobs for six Summer Income students at a high school. Estimate the income of the following students John a. Ryan b. Mary Man Susar Ryan a. Approximately how much did Ryan make? William George O A. $1900 O B. $19.00 1000 2000 3000 4000 Dollars (S) O C. $1700 O D. $2100 b. Approximately how much did Mary make? O A. $11 00 O B. $1300 O C. $900 O D. $1100 Click to select your

Step by Step Solution

There are 3 Steps involved in it

1 Expert Approved Answer
Step: 1 Unlock blur-text-image
Question Has Been Solved by an Expert!

Get step-by-step solutions from verified subject matter experts

Step: 2 Unlock
Step: 3 Unlock

Students Have Also Explored These Related Mathematics Questions!