

Question: Chapter_05 i Saved Help Save & Exit Sub Check my work 2 Refer to the profit maximization table below. A fisher who sells his mackerel
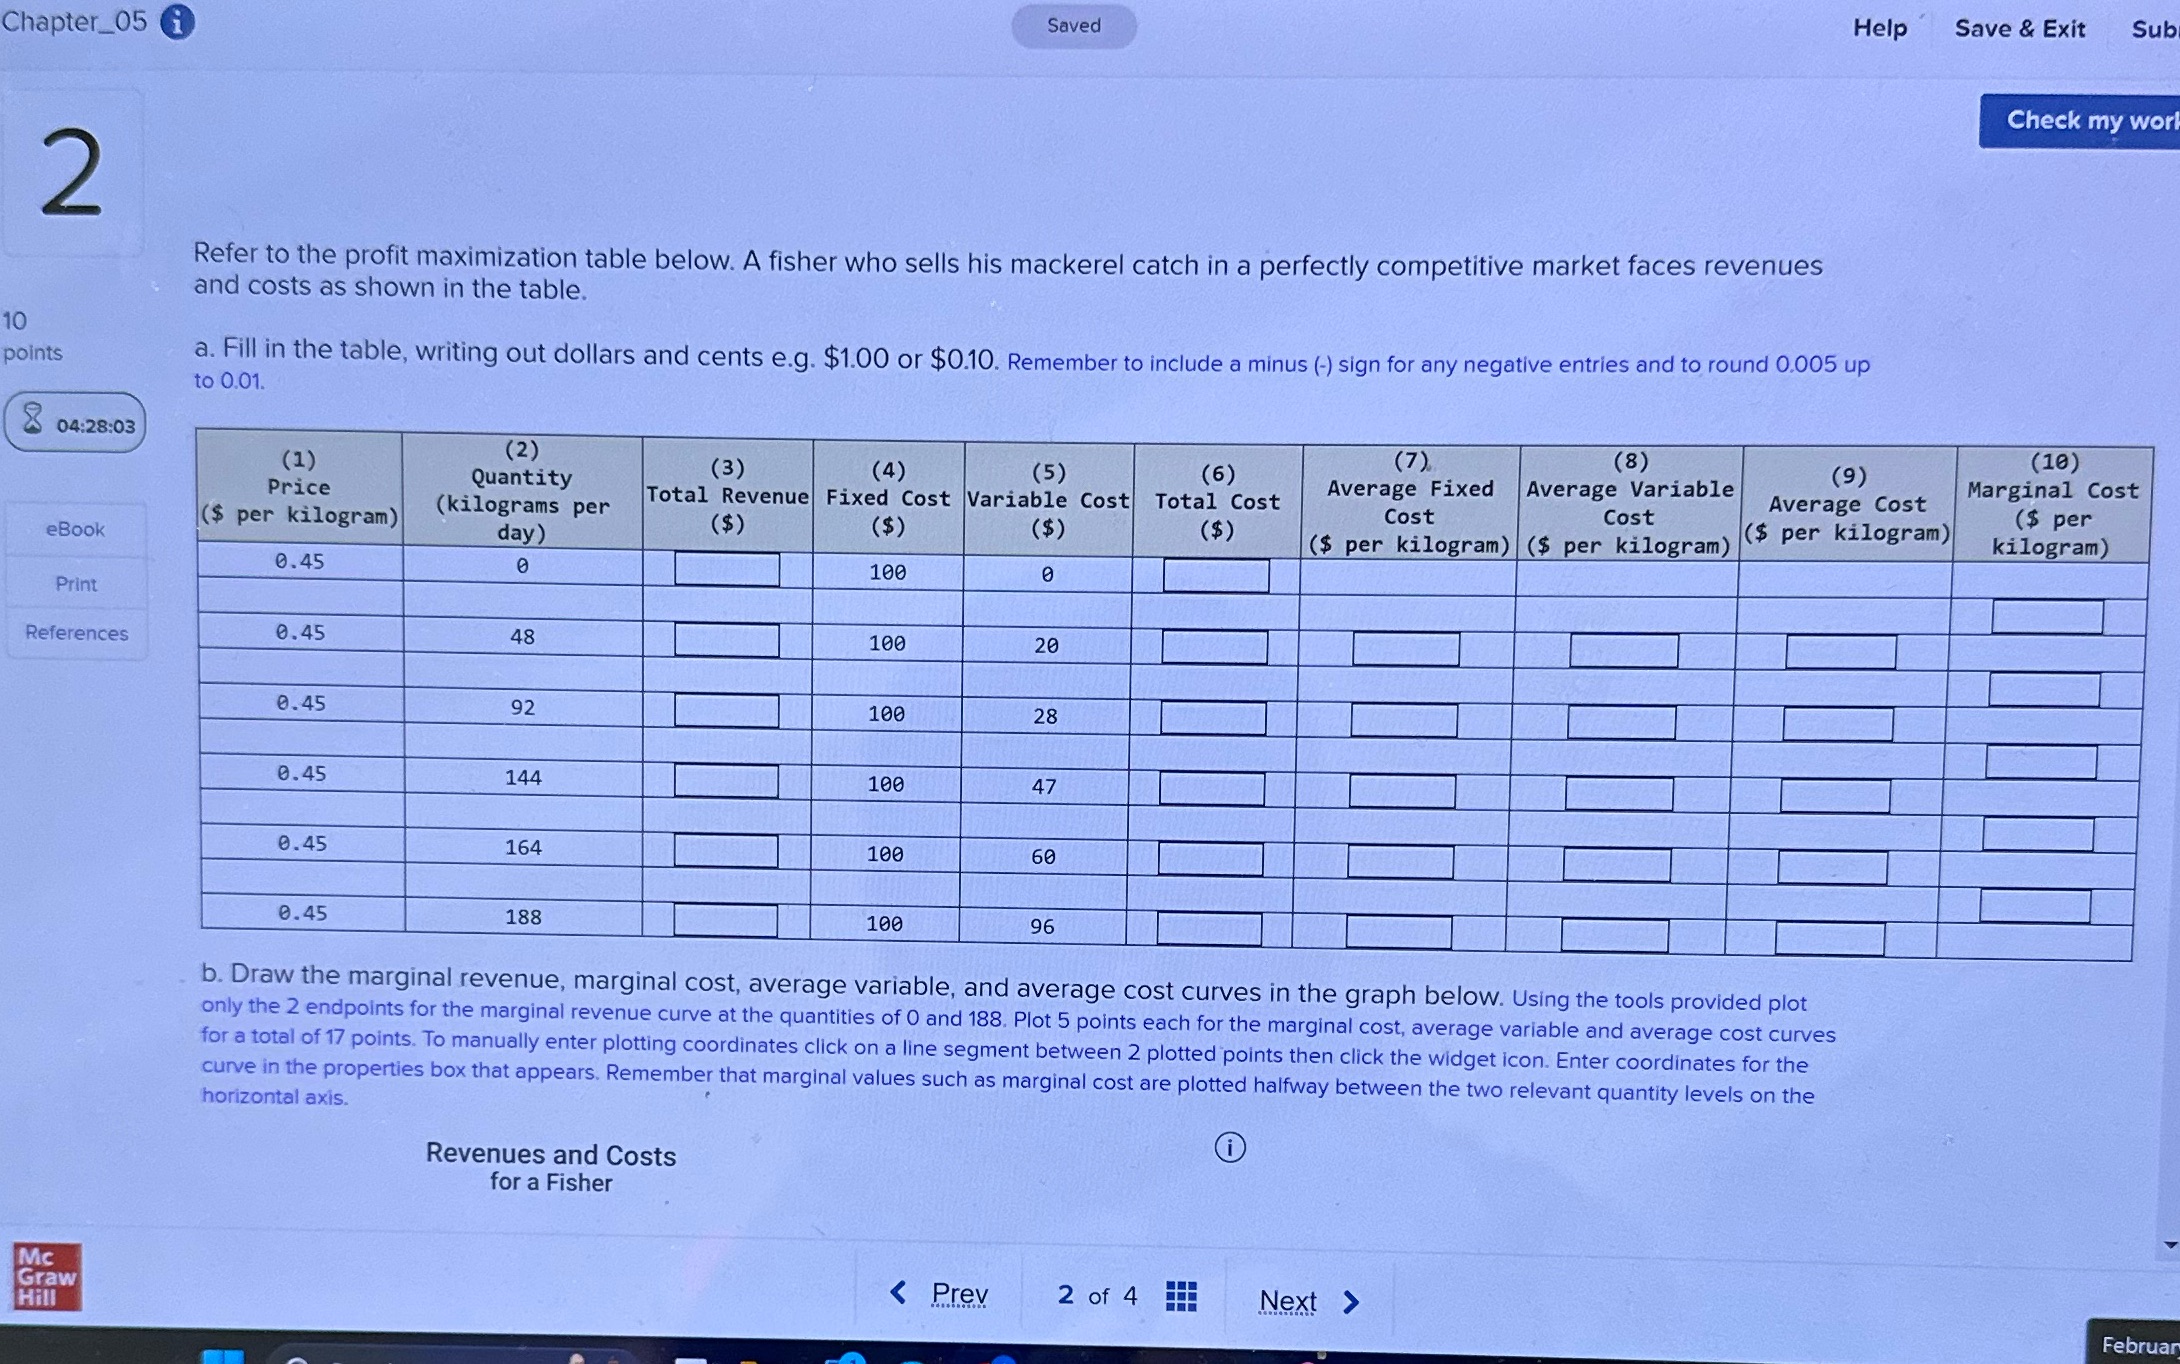

Chapter_05 i Saved Help Save & Exit Sub Check my work 2 Refer to the profit maximization table below. A fisher who sells his mackerel catch in a perfectly competitive market faces revenues and costs as shown in the table. 10 points a. Fill in the table, writing out dollars and cents e.g. $1.00 or $0.10. Remember to include a minus (-) sign for any negative entries and to round 0.005 up to 0.01. 04:28:03 (1) (2) (7 ). (8) (10) Quantity (3) (4) (5) (6) Average Fixed Average Variable (9) Price Marginal Cost Total Revenue Fixed Cost Variable Cost Total Cost ($ per kilogram) (kilograms per ($) ($ ) Cost Cost Average Cost eBook ($ per kilogram) ($ per day ($) ($ ) ($ per kilogram) ($ per kilogram) kilogram) 0. 45 100 Print References 0.45 48 100 20 0. 45 92 100 28 3.45 144 100 47 0. 45 164 106 60 0.45 188 100 96 b. Draw the marginal revenue, marginal cost, average variable, and average cost curves in the graph below. Using the tools provided plot only the 2 endpoints for the marginal revenue curve at the quantities of 0 and 188. Plot 5 points each for the marginal cost, average variable and average cost curves for a total of 17 points. To manually enter plotting coordinates click on a line segment between 2 plotted points then click the widget icon. Enter coordinates for the curve in the properties box that appears. Remember that marginal values such as marginal cost are plotted halfway between the two relevant quantity levels on the horizontal axis. Revenues and Costs for a Fisher Mc Graw Hill Februar
Step by Step Solution
There are 3 Steps involved in it

Get step-by-step solutions from verified subject matter experts