

Question: The following table shows the nominal interest rate for U.S. Treasury bonds with different maturities in September between 2021 and 2023: Time 30/09/21 30/09/22
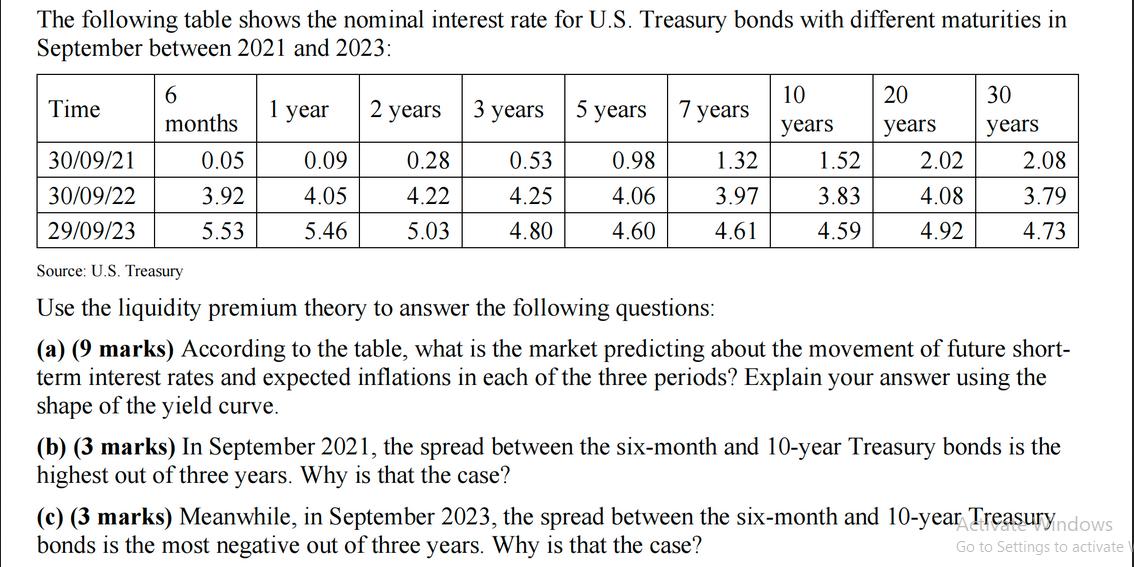
The following table shows the nominal interest rate for U.S. Treasury bonds with different maturities in September between 2021 and 2023: Time 30/09/21 30/09/22 29/09/23 6 months 0.05 3.92 5.53 1 year 2 years 3 years 5 years 0.09 0.28 0.53 0.98 4.05 4.22 4.25 4.06 5.46 5.03 4.80 4.60 7 years 1.32 3.97 4.61 10 years 1.52 3.83 4.59 20 years 2.02 4.08 4.92 30 years 2.08 3.79 4.73 Source: U.S. Treasury Use the liquidity premium theory to answer the following questions: (a) (9 marks) According to the table, what is the market predicting about the movement of future short- term interest rates and expected inflations in each of the three periods? Explain your answer using the shape of the yield curve. (b) (3 marks) In September 2021, the spread between the six-month and 10-year Treasury bonds is the highest out of three years. Why is that the case? (c) (3 marks) Meanwhile, in September 2023, the spread between the six-month and 10-year Treasuryndows bonds is the most negative out of three years. Why is that the case? Go to Settings to activate
Step by Step Solution
3.41 Rating (151 Votes )
There are 3 Steps involved in it

Get step-by-step solutions from verified subject matter experts