

Characteristics of Each Organization Colleen's ORG ORG A ORG B ORG C Points of Service Patients...
Fantastic news! We've Found the answer you've been seeking!
Question:

Transcribed Image Text:
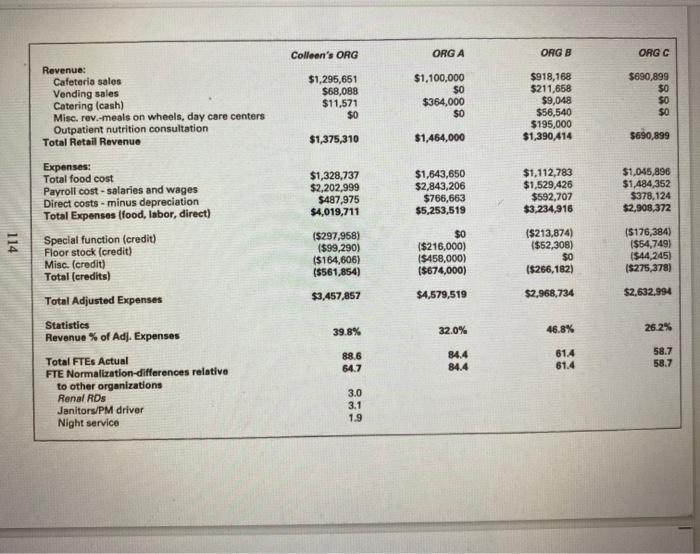
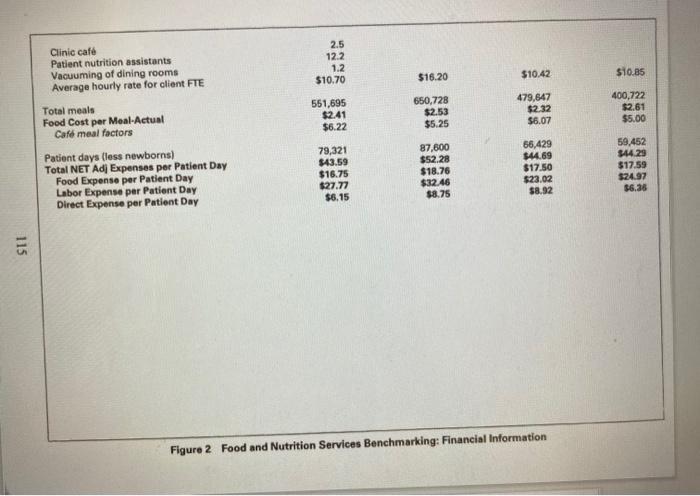
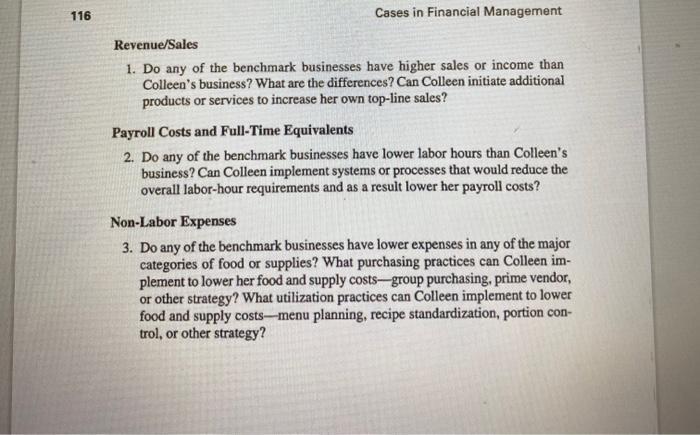
Characteristics of Each Organization Colleen's ORG ORG A ORG B ORG C Points of Service Patients Cafeterias Vending Catering (cash) Coffee kiosk in lobby Meals on wheels, day care centers Outpatient nutrition consultation Food Purchasing Food Production System Weekly Menu Planning Focus Department Payroll Regional renal dialysis center Provide all environmental service needs for department Provide night (3rd shift) food service Yes, same building 1 Cafe Yes, same building 2 Cafés Receives commission Yes Yes, same building 2 Cafes Receives commission Yes Yes No Yes, same building 1 Cafe Does own vending Yes No income No No No No No Yes No No No Yes No Purchasing group Cook serve Medium Purchasing group Cook serve Medium Purchasing group Cook serve High Purchasing group Cook serve Medium No No No No No No Yes Yes Yes Yes No No Yes Yes No No Provide host/hostess program for patients Direct Costs Serviceware for patients Serviceware for staff and visitors Statistics Total Meals Café meal tactors China China China China China China Disposables China 650,728 $5.25 236 Full service hospital 87,600 479,647 $6.07 400 400,722 $5.00 254 551,695 $6.22 Beds 490 Tertiary care hospital 79,321 Full service hospital Tertiary care hospital 66,429 59,452 Patient days (less newborns) Figure 1 Food and Nutrition Services Benchmarking: Characteristics 113 Colleen's ORG ORG A ORG B ORG C Revenue: Cafeteria sales Vending sales Catering (cash) Misc. rev.-meals on wheels, day care centers Outpatient nutrition consultation Total Retail Revenue $918,168 $211,658 $9,048 $56,540 $195,000 $1,390,414 $690,899 $0 $1,100,000 $1,295,651 $68,088 $11,571 $0 $364,000 $1,375,310 $1,464,000 $690,899 Expenses: Total food cost Payroll cost - salaries and wages Direct costs - minus depreciation Total Expenses (food, labor, direct) $1,328,737 $2,202,999 $487,975 $4,019,711 $1,643,650 $2,843,206 $766,663 $5,253,519 $1,112,783 $1,529,426 $592,707 $3,234,916 $1,045,896 $1,484,352 $378,124 $2,908,372 Special function (credit) Floor stock (credit) Misc. (credit) Total (credits) ($297,958) ($99,290) ($164,606) (5561,854) $0 ($216,000) (S458,000) ($674,000) ($213,874) ($52,308) $0 ($266,182) (S176,384) ($54,749) ($44,245) ($275,378) $3,457,857 $4,579,519 $2,968,734 $2,632.994 Total Adjusted Expenses Statistics Revenue % of Adj. Expenses 39.8% 32.0% 46.8% 26.2% 61.4 61.4 58.7 58.7 84.4 88.6 64.7 Total FTES Actual FTE Normalization-differences relative to other organizations Renal RDs Janitors/PM driver Night service 84.4 3.0 3.1 1.9 114 Clinic café Patient nutrition assistants Vacuuming of dining rooms Average hourly rate for olient FTE 2.5 12.2 1.2 $10.70 $16.20 $10.42 $10.85 Total meals Food Cost per Meal-Actual Café meal factors 551,695 $2.41 $6.22 650,728 $2.53 $5.25 479,647 $2.32 $6.07 400,722 $2.61 $5.00 Patient days (less newborns) Total NET Adj Expenses per Patient Day Food Expense per Patient Day Labor Expense per Patient Day Direct Expense per Patient Day 87,600 $52.28 $18.76 $32.46 $8.75 66,429 $44.69 $17.50 $23.02 $8.92 59,452 79,321 $43.59 $16.75 $27.77 $6.15 $44.29 $17.59 $24.97 $6.36 Figure 2 Food and Nutrition Services Benchmarking: Financial Information 115 116 Cases in Financial Management Revenue/Sales 1. Do any of the benchmark businesses have higher sales or income than Colleen's business? What are the differences? Can Colleen initiate additional products or services to increase her own top-line sales? Payroll Costs and Full-Time Equivalents 2. Do any of the benchmark businesses have lower labor hours than Colleen's business? Can Colleen implement systems or processes that would reduce the overall labor-hour requirements and as a result lower her payroll costs? Non-Labor Expenses 3. Do any of the benchmark businesses have lower expenses in any of the major categories of food or supplies? What purchasing practices can Colleen im- plement to lower her food and supply costs-group purchasing, prime vendor, or other strategy? What utilization practices can Colleen implement to lower food and supply costs-menu planning, recipe standardization, portion con- trol, or other strategy? Characteristics of Each Organization Colleen's ORG ORG A ORG B ORG C Points of Service Patients Cafeterias Vending Catering (cash) Coffee kiosk in lobby Meals on wheels, day care centers Outpatient nutrition consultation Food Purchasing Food Production System Weekly Menu Planning Focus Department Payroll Regional renal dialysis center Provide all environmental service needs for department Provide night (3rd shift) food service Yes, same building 1 Cafe Yes, same building 2 Cafés Receives commission Yes Yes, same building 2 Cafes Receives commission Yes Yes No Yes, same building 1 Cafe Does own vending Yes No income No No No No No Yes No No No Yes No Purchasing group Cook serve Medium Purchasing group Cook serve Medium Purchasing group Cook serve High Purchasing group Cook serve Medium No No No No No No Yes Yes Yes Yes No No Yes Yes No No Provide host/hostess program for patients Direct Costs Serviceware for patients Serviceware for staff and visitors Statistics Total Meals Café meal tactors China China China China China China Disposables China 650,728 $5.25 236 Full service hospital 87,600 479,647 $6.07 400 400,722 $5.00 254 551,695 $6.22 Beds 490 Tertiary care hospital 79,321 Full service hospital Tertiary care hospital 66,429 59,452 Patient days (less newborns) Figure 1 Food and Nutrition Services Benchmarking: Characteristics 113 Colleen's ORG ORG A ORG B ORG C Revenue: Cafeteria sales Vending sales Catering (cash) Misc. rev.-meals on wheels, day care centers Outpatient nutrition consultation Total Retail Revenue $918,168 $211,658 $9,048 $56,540 $195,000 $1,390,414 $690,899 $0 $1,100,000 $1,295,651 $68,088 $11,571 $0 $364,000 $1,375,310 $1,464,000 $690,899 Expenses: Total food cost Payroll cost - salaries and wages Direct costs - minus depreciation Total Expenses (food, labor, direct) $1,328,737 $2,202,999 $487,975 $4,019,711 $1,643,650 $2,843,206 $766,663 $5,253,519 $1,112,783 $1,529,426 $592,707 $3,234,916 $1,045,896 $1,484,352 $378,124 $2,908,372 Special function (credit) Floor stock (credit) Misc. (credit) Total (credits) ($297,958) ($99,290) ($164,606) (5561,854) $0 ($216,000) (S458,000) ($674,000) ($213,874) ($52,308) $0 ($266,182) (S176,384) ($54,749) ($44,245) ($275,378) $3,457,857 $4,579,519 $2,968,734 $2,632.994 Total Adjusted Expenses Statistics Revenue % of Adj. Expenses 39.8% 32.0% 46.8% 26.2% 61.4 61.4 58.7 58.7 84.4 88.6 64.7 Total FTES Actual FTE Normalization-differences relative to other organizations Renal RDs Janitors/PM driver Night service 84.4 3.0 3.1 1.9 114 Clinic café Patient nutrition assistants Vacuuming of dining rooms Average hourly rate for olient FTE 2.5 12.2 1.2 $10.70 $16.20 $10.42 $10.85 Total meals Food Cost per Meal-Actual Café meal factors 551,695 $2.41 $6.22 650,728 $2.53 $5.25 479,647 $2.32 $6.07 400,722 $2.61 $5.00 Patient days (less newborns) Total NET Adj Expenses per Patient Day Food Expense per Patient Day Labor Expense per Patient Day Direct Expense per Patient Day 87,600 $52.28 $18.76 $32.46 $8.75 66,429 $44.69 $17.50 $23.02 $8.92 59,452 79,321 $43.59 $16.75 $27.77 $6.15 $44.29 $17.59 $24.97 $6.36 Figure 2 Food and Nutrition Services Benchmarking: Financial Information 115 116 Cases in Financial Management Revenue/Sales 1. Do any of the benchmark businesses have higher sales or income than Colleen's business? What are the differences? Can Colleen initiate additional products or services to increase her own top-line sales? Payroll Costs and Full-Time Equivalents 2. Do any of the benchmark businesses have lower labor hours than Colleen's business? Can Colleen implement systems or processes that would reduce the overall labor-hour requirements and as a result lower her payroll costs? Non-Labor Expenses 3. Do any of the benchmark businesses have lower expenses in any of the major categories of food or supplies? What purchasing practices can Colleen im- plement to lower her food and supply costs-group purchasing, prime vendor, or other strategy? What utilization practices can Colleen implement to lower food and supply costs-menu planning, recipe standardization, portion con- trol, or other strategy?
Expert Answer:
Answer rating: 100% (QA)
Answer to Question 1 Revenue Sales Colleens ORG ORG A ORG B ORG C Total Revenue 1375310 1464000 1390... View the full answer

Related Book For 

Elementary Statistics A step by step approach
ISBN: 978-0073386102
8th edition
Authors: Allan Bluman
Posted Date:
Students also viewed these accounting questions
-
Meals on Wheels (MOW) operate a meal home-delivery service. It has agreements with 20 restaurants to pick up and deliver meals to customers who phone or fax orders to MOW. MOW allocates variable and...
-
A group of 101 patients with end-stage renal disease were given the drug epoetin.19 The mean hemoglobin level of the patients was 10.3 (g/dl), with an SD of 0.9. Construct a 95% confidence interval...
-
Use the method of linear programming to solve the following on graph paper. 1. A nutrition center sells health food to mountain-climbing teams. The Trailblazer mix package contains one pound com...
-
Christine has three cars that must be overhauled by her ace mechanic, Megan. Given the following data about the cars, use least slack per remaining operation to determine Megans scheduling priority...
-
Six years ago, Donna purchased land as an investment. The land cost $150,000 and is now worth $480,000. Donna plans to transfer the land to Development Corporation, which will subdivide it and sell...
-
A 2.25-g sample of scandium metal is reacted with excess hydrochloric acid to produce 0.1502 g hydrogen gas. What is the formula of the scandium chloride produced in the reaction?
-
Determine whether each of the following is true or false. In each case, assume \(P\) is located at \(t=0\) and \(F\) is located at \(t=n\), and the \(A\) s are spread uniformly over the planning...
-
Rocky Mountain Corporation makes two types of hiking bootsXactive and the Pathbreaker. Data concerning these two product lines appear below: The company has a traditional costing system in which...
-
The N excess/deficit factor for 100 kg of an organic material that contained 60% C (carbon) and 0.5% N (nitrogen) would likely be (assuming that 35% of the carbon is metabolized by microorganisms and...
-
The proposed rates were not in the range the CEO expected given the pricing analysis. The CEO has asked the pricing actuary to verify the total projected loss cost excluding potential large storm...
-
Write C++ program to take input in variables "n" and "L" from user and print following character pattern. For reference, ASCII chart is also given below. Sample inputs and output are shown below n=5,...
-
Sheng Siong is one of Singapore's largest retailers with 64 stores located all across the island. Sheng Siong's chain stores are designed to provide customers with both "wet and dry" shopping options...
-
4. Interrupt priority. Suppose that the interrupt sources Timero clear timer on compare match (CTC), external interrupt 1 (INT1), and the transmit complete serial interrupt are enabled. Answer the...
-
The Government of Canada auctioned a new benchmark 2 year bond, to settle on October 2nd, 2020. The bond has a maturity of November 1st, 2022. Assume the bond pays coupons semi-annually and has an...
-
For the block diagram shown below, find the transfer function Y(s) U(s) answer. Step U(s) Answer: Y(s) U(s) Use proper form to represent the transfer function in your 1 S+2 Y(s) Transfer Fcn Scope...
-
(a) The following information on credit and advances are found in the book of Jack and Jane bank: i. Letter of credit GHC40000.00 ii. iii. iv. Mortgage GHC23000.00 Personal loan GHC2400 Bankers'...
-
Pls create flow chart as per the give information Flowchart Description: Start : An oval at the top labeled "Start." New Product Arrives : Rectangle labeled "New Product Arrives." Arrow pointing from...
-
Explain what is meant by vicarious liability and when it is available?
-
The data shown are the total compensation (in millions of dollars) for the 50 top-paid CEOs for a recent year. Compare the averages, and state which one you think is the best measure. Find the a....
-
An instructor wishes to see whether grades of students who finish an exam occur at random. Shown here are the grades of 30 students in the order that they finished an exam. (Read from left to right...
-
Is there a relationship between the number of motor vehicle (MV) thefts and the number of burglaries (per 100,000 populations) for different metropolitan areas? Use α = 0.05. Perform...
-
Division A has been offered a project costing $\$ 100,000$ and giving annual returns of $\$ 20,000$. Division $B$ has been offered a project costing $\$ 100,000$ and giving annual returns of $\$...
-
An investment centre has reported a profit of $\$ 28,000$. It has the following assets and liabilities: The $\mathrm{ROI}$ for the division is $\$$ __________________ $\%$. $ Non-current assets (at...
-
Nielsen Ltd has two divisions with the following information: Division A has been offered a project costing $\$ 100,000$ and giving annual returns of $\$ 20,000$. Division $B$ has been offered a...

Study smarter with the SolutionInn App