

Question: Chart 1: Total in Percentages for Each Column Chart 2: Overall Total in Percentages for Each Section Compare and contrast the above two charts. Please
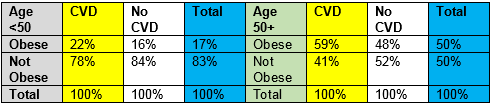
Chart 1: Total in Percentages for Each Column
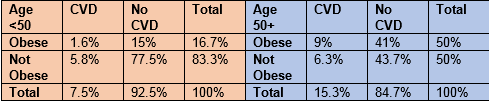
Chart 2: Overall Total in Percentages for Each Section
Compare and contrast the above two charts. Please be sure to identify independent and dependent variables listed in these charts.
Step by Step Solution
There are 3 Steps involved in it
1 Expert Approved Answer
Step: 1 Unlock

Question Has Been Solved by an Expert!
Get step-by-step solutions from verified subject matter experts
Step: 2 Unlock
Step: 3 Unlock