

Question: (Chart attached is meant for #5) 1. A quick survey of peanut butter prices had standard deviation and mean of $0.26 and $3.68, respectively. Compute
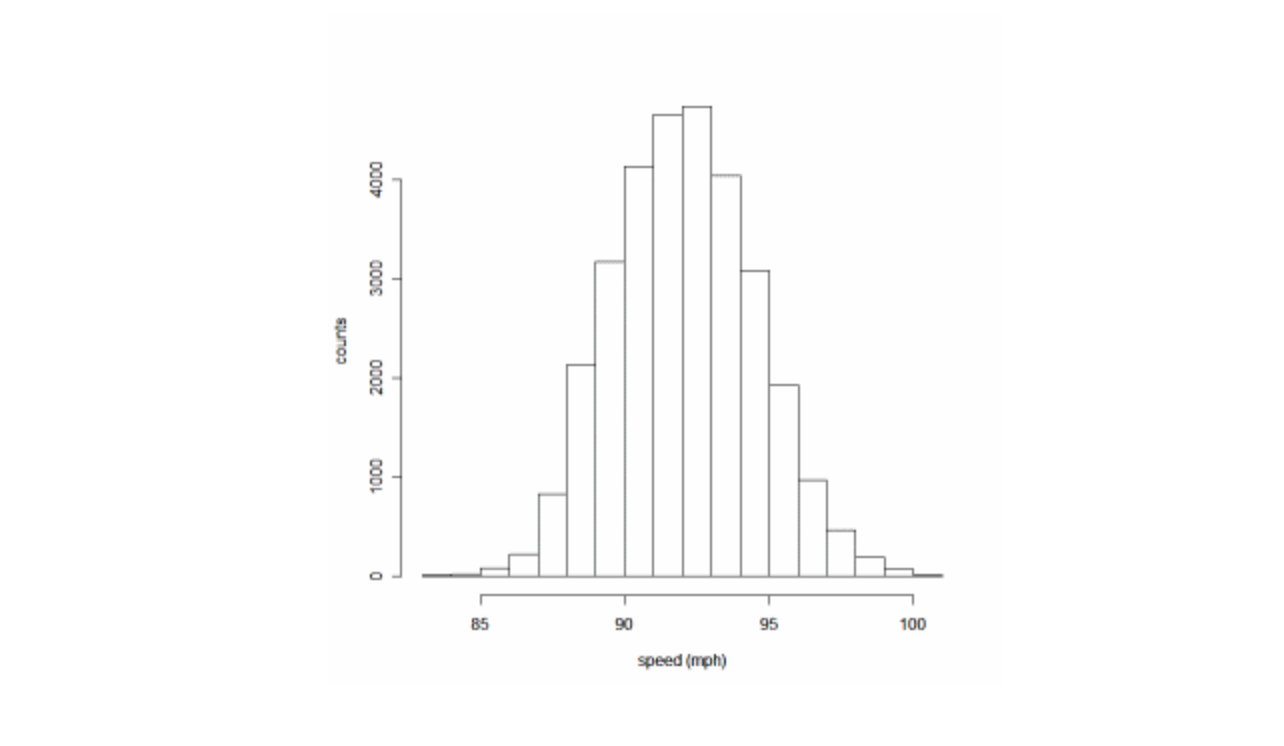
(Chart attached is meant for #5)
1.A quick survey of peanut butter prices had standard deviation and mean of $0.26 and $3.68, respectively. Compute the area for a peanut butter jar costing less than $3.50.
2.A quick survey of peanut butter prices had standard deviation and mean of $0.26 and $3.68, respectively. Compute the area for a peanut butter jar costing between $3.50 and $4.25.
3.Suppose that the distance of fly balls hit to the outfield (in baseball) is normally distributed with a mean of 253 feet and a standard deviation of 56 feet.
Use your graphing calculator to answer the following questions. Write the answers inpercentform. Round your answers to the nearest tenth of a percent.
a) If one fly ball is randomly chosen from this distribution, what is the probability that this ball traveled fewer than 216 feet?P
(fewer than 216 feet) = %
b) If one fly ball is randomly chosen from this distribution, what is the probability that this ball traveled more than 228 feet?P
(more than 228 feet) = %
4.A manufacturer knows that their items have a normally distributed lifespan, with a mean of 10.2 years, and standard deviation of 3.3 years.
The 5% of items with the shortest lifespan will last less than how many years? Give your answer to one decimal place.
\f
Step by Step Solution
There are 3 Steps involved in it

Get step-by-step solutions from verified subject matter experts