

Question: Chart Explanations Let's say the information in the chart above represents people who own insurance. BASE TOTAL 000 This is the total population of that
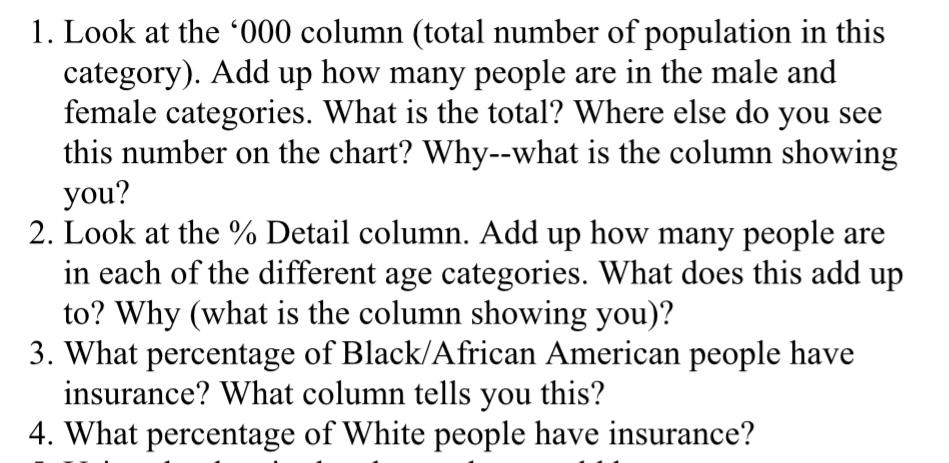


Chart Explanations Let's say the information in the chart above represents people who own insurance. BASE TOTAL 000 This is the total population of that item represented by a survey. Since this database basically represents the whole U.S. population over age 18, that tells you, for example, that there are about 242 million U.S. adults in total, 125 million women, 31 million with household income over $150,000+, etc. 000 This next column represents the total number of that population who fit your definition. In other words, there are 114 million Americans in total who own insurance policies. There are 59 million women who own them, etc. % DETAIL Let's skip over % Detail for now; the chart is just easier to explain that way. % TARGET The % Target column is simply the \"*000\" column divided by the \"Base Total 000 column for each criterion. It tells what percentage of the total population is made up by the group of interest. So, for example, in the chart above, on the row called \"Race: Asian\" the % Target number is 38.61. That means that 38.61 percent of Asian adults (over 18 years old) own insurance. You can quickly compare that to the results for other races or income levels or education levels, etc. The % Target of people 65+ is more than twice as high as people 25-34 years old. That, for example, can be important information when picking a target for advertising. INDEX The index column is incredibly useful and one of the first places to look on the chart. It shows how the \"% Target\" number compares to the average for all people. We can see that Asian Americans index at 82. That is the 38.61 percent of Asians who own insurance divided by the 47.24 percent of all Americans who own insurance. In other words, Asian Americans are 82 percent as likely as the average American to buy insurance. By looking at the indices first, it can be determined whether each row is above or below average and whether they are a little above or below, or way above or below. % DETAIL We saved this for last because it can be confusing and because \"% Detail\" 1s a vague title. This column simply shows what percentage of the population is made up by the row in question. As you can see, there are six education breaks in the chart. The index for people with a \"Post Graduate\" education indexes at 141. It has a high index because its \"% Target\" number is high. In other words, a lot of post graduates use the product (in this case, they own insurance). You might assume that they are your best target. They are a great target, but they only make up 14.79 percent (% Detail = 14.79) of the population. Pcople who attended no college have a much lower index (81), but there are more than two and a half times more of them. They make up 38.55 percent of the population (% Detail = 38.55). You need to take both \"% Target\" and \"% Detail\" into account in your decision making process. No single number is most important. Looking at them all gives you the information you need to start making some decisions about your targeting strategy. _ . Look at the '000 column (total number of population in this category). Add up how many people are in the male and female categories. What 1s the total? Where else do you see this number on the chart? Why--what is the column showing you? 2. Look at the % Detail column. Add up how many people are in each of the different age categories. What does this add up to? Why (what 1s the column showing you)? 3. What percentage of Black/African American people have insurance? What column tells you this? 4. What percentage of White people have insurance? Example Chart Based on a GfK MRI Chart TARGET BASE TOTAL '000 '000 % DETAIL % TARGET INDEX TOTAL 242,261 114,439 100.000 47.24 100 MEN 116,965 55,226 48.26 47.22 100 WOMEN 125,296 59,213 51.74 47.26 100 AGE 18-24 30,255 4,826 4.22 15.95 34 AGE 25-34 42, 994 13,303 11.62 30.94 66 AGE 35-44 40,104 19,146 16.73 47.74 101 AGE 45-54 43, 102 24,205 21.15 56.16 119 AGE 55-64 40,273 24,625 21.52 61.15 129 AGE 65+ 45,533 28,334 24.76 62.23 132 EDU: GRADUATED COLLEGE + 71.542 43,986 38.44 61.48 130 EDU: ATTENDED COLLEGE 69,219 31,328 27.38 45.26 96 EDU: GRADUATED HIGH SCHOOL (HS) 71,696 30,908 27.01 43.11 91 EDU: DID NOT GRADUATE HS 29,804 8,218 7.18 27.57 58 EDU: POST GRADUATE 25,425 16,926 14.79 56.57 141 EDU: NO COLLEGE 101,500 39,126 34.19 38.55 82 HHI $150,000+ 31,309 20,312 17.75 64.87 137 HHI $75,000-$149,999 71,365 44,393 38.79 62.21 132 HHI $60,000-$74,999 25,108 12,401 10.84 49.39 105 HHI $50,000-$59,999 18,706 8,910 7.79 47.63 101 HHI $40,000-$49,999 20,470 8,350 7.30 40.79 86 HHI $30,000-$39,999 21,877 8,306 7.26 37.97 80 HHI $20,000-$29,999 21,434 6,259 5.47 29.20 62 HHI >$20,000 31,991 5,509 4.81 17.22 36 RACE: American Indian or Alaska Native 2.622 738 0.65 28.17 60 RACE: Asian 8,610 3,324 2.90 38.61 82 RACE: Black/African American 30,508 7,784 6.80 25.51 54 RACE: Black/African American only 29.280 7,565 6.61 25.84 55 RACE: Other 22.683 5,617 4.91 24.76 52 RACE: Other Race/Multiple Classifications 34,170 9.689 8.47 28.36 50 RACE: White 182,398 98,198 85.81 53.84 14 RACE: White only 178,811 97,186 84.92 54.35 115Overview This exercise is connected to content found under the Demographics and Psychographics heading in Section 4: Quantitative and Qualitative Research of Chapter 7. As the chapter states, \"One of the largest random sample surveys available to advertisers...i1s GfK's MRI (Mediamark Research, Inc.) database, which surveys 25,000 Americans every year in order to give detailed demographics about U.S. consumers and the products they buy. The fact that this information is based on specific brands and categories makes it more useful to marketers than census data.\" GfK's MRI database provides demographic information about the population in general and for categories and brands. The following page presents a chart based on a GfK MRI chart. To read and interpret numbers in GfK's MRI charts, see the explanations provided
Step by Step Solution
There are 3 Steps involved in it

Get step-by-step solutions from verified subject matter experts