

Question: Chart the data below in several ways, enough so you can talk about which modeling tool you should use. Then propose which modeling tools you
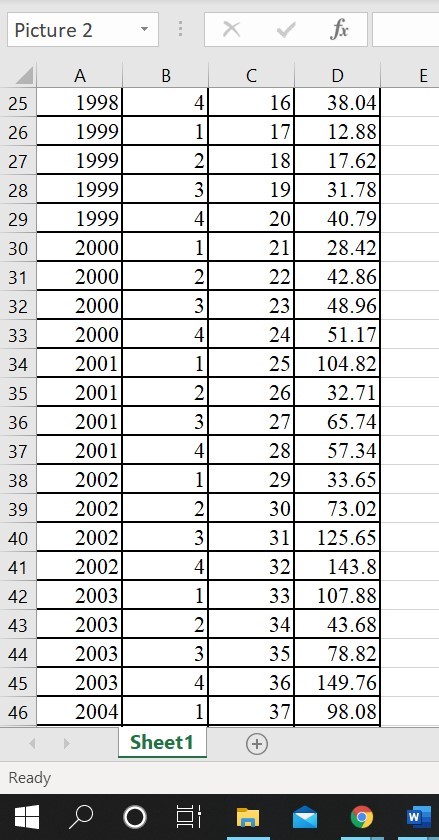
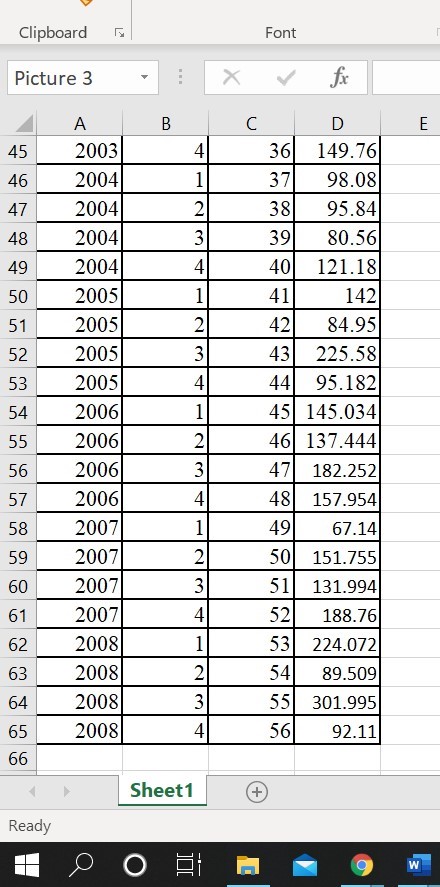
Chart the data below in several ways, enough so you can talk about which modeling tool you should use. Then propose which modeling tools you are going to use and, based on/supported by your charts, why you will use those methods. Using split data modeling conduct a regression with categorical variables to make forecast model. Discuss the information in the regression output, is it a good model, do all of the IV variables hold up or do you need to eliminate some, if so, eliminate them and run the regression again. Once you have the correct IV's, test the model on the last two years of data that you held out of your model. Use CFE, MSE, MAD, and MAPE to test the model. Discuss your CFE, MSE, MAD, and MAPE. What information do they provide? Then create four quarters of forecasts with the upper and lower confidence intervals of those forecasts.
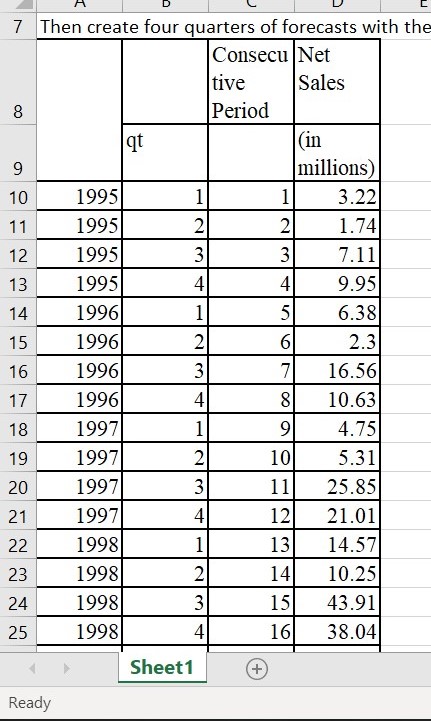
3 .22 Censecu Net XI}. 5 n U h 1 .1 E In 1995 7' Then create four quarters of forecasts with the Reach.r \f\f
Step by Step Solution
There are 3 Steps involved in it

Get step-by-step solutions from verified subject matter experts