

Question: Charts, Graphs and Tables Problem Sample Problem #1: Tablesl' Charts f Graphs Problem: The followin r data shows the a r es of a students
Charts, Graphs and Tables Problem
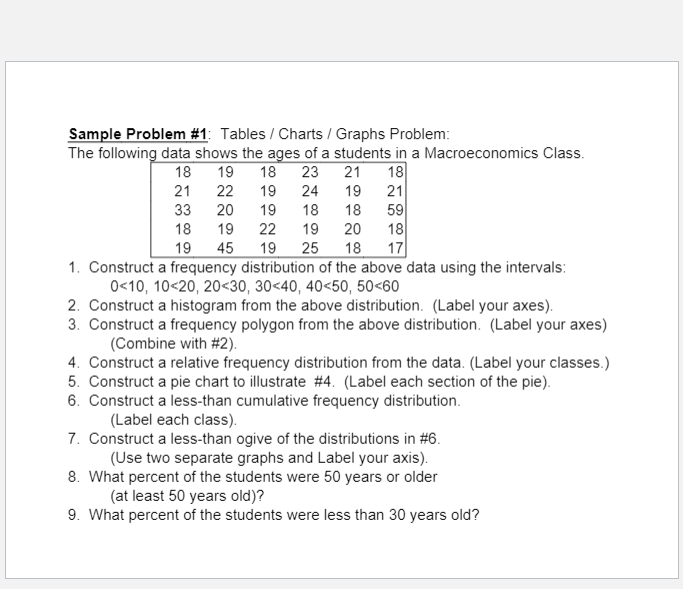
Sample Problem #1: Tablesl' Charts f Graphs Problem: The followin r data shows the a r es of a students in a Macroeconomics Class. 13 19 13 23 21 13 21 22 19 24 19 21 33 29 19 13 13 59 13 19 22 19 29 13 13 43 13 23 13 1? . Construct a frequency distribution of the above data using the intervals: 3:19. 19:29. 29:39. 39:49. 43:59. 53:39 . Construct a histogram from the above distribution. {Label your axes]. . Construct a frequency polygon from the above distribution. [Label your axes} {Combine with #2}. . Construct a relative frequency distribution from the data. {Label your classes.) . Construct a pie chart to illustrate #4. {Label each section of the pie}. . Construct a less-than cumulative frequency distribution. (Label each class). . Construct a less-than ogive of the distributions in #3. (Use two separate graphs and Label your axis]. . What percent of the students were 59 years or older [at least 59 years old}? _ What percent of the students were less than 33 years old
Step by Step Solution
There are 3 Steps involved in it

Get step-by-step solutions from verified subject matter experts