

Chateau Latour is widely acknowledged as one of the world's greatest wine estates with a rich...
Fantastic news! We've Found the answer you've been seeking!
Question:

Transcribed Image Text:
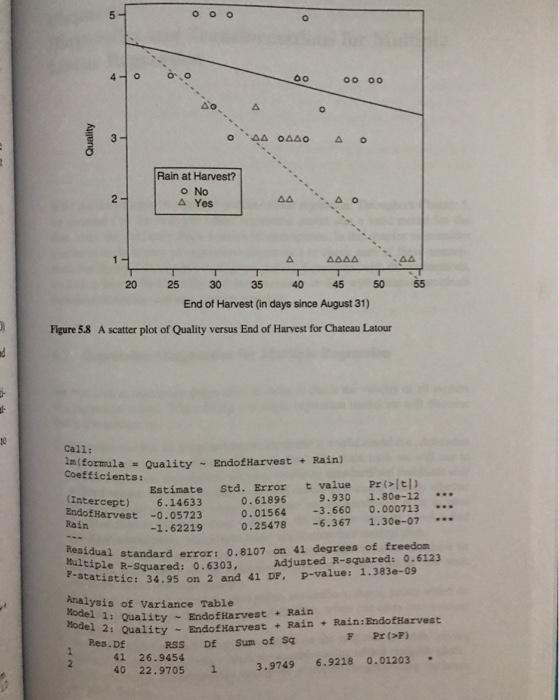
Chateau Latour is widely acknowledged as one of the world's greatest wine estates with a rich history dating back to at least 1638. The Grand Vin de Chateau Latour is a wine of incredible power and longevity. At a tasting in New York in April 2000, the 1863 and 1899 vintages of Latour were rated alongside the 1945 and the 1961 vintages as the best in a line-up of 39 vintages ranging from 1863 to 1999 (Wine Spectator, August 31, 2000). Quality of a particular vintage of Chateau Latour has a huge impact on price. For example, in March 2007, the 1997 vintage of Chateau Latour could be purchased for as little as $159 per bottle while the 2000 vintage of Chateau Latour costs as least $700 per bottle (www.wine-searcher.com). While many studies have identified that the timing of the harvest of the grapes has an important effect on the quality of the vintage, with quality improving the earlier the harvest. A less explored issue of interest is the effect of unwanted rain at vintage time on the quality of icon wine like Chateau Latour. This question addresses this issue. The Chateau Latour web site (www.chateau-latour.com) provides a tich source of data. In particular, data on the quality of each vintage, harvest dates and weather at harvest time were obtained from the site for the vintages from 1961 to 2004. An example of the information on weather at harvest time is given below for the 1994 vintage: Harvest began on the 13th September and lasted on the 29th, frequently interrupted by storm showers. But quite amazingly the dilution effect in the grapes was very limited... (http://www.chateau-latour.com/commentaires/1994uk.html"; Accessed: March 16, 2007) Each vintage was classified as having had "unwanted rain at harvest" (c.g., the 1994 vintage) or not (e.g., the 1996 vintage) on the basis of information like that reproduced above. Thus, the data consist of: Vintage = year the grapes were harvested Quality - on a scale from 1 (worst) to 5 (best) with some half points End of harvest - measured as the number days since August 31 Rain a dummy variable for unwanted rain at harvest = 1 if yes. The data can be found on the book web site in the file latour.csv. The first model considered was: (5.10) A plot of the data and the two regression lines from model (5.10) can be found in Figure 5.8. In addition, numerical output appears below. Quality = B, + B, End of Harvest + B, Rain + B, End of Harvest x Rain + e (a) Show that the coefficient of the interaction term in model (5.10) is statisti- cally significant. In other words, show that the rate of change in quality rat- ing depends on whether there has been any unwanted rain at vintage. (b) Estimate the number of days of delay to the end of harvest it takes to decrease the quality rating by 1 point when there is: (i) No unwanted rain at harvest (ii) Some unwanted rain at harvest Regression output from R Call: 1m (formula = Quality - EndofHarvest+ Rain Rain: Endof Harvest) Coefficients: Estimate 5.16122 -0.03145 1.78670 EndofHarvest: Rain -0.08314 (Intercept) EndofHarvest Rain Std. Error t value Pr(>/t/) 0.68917 7.489 3.95e-09 0.01760 -1.787 1.31740 0.03160 1.356 -2.631 standard error: 0.7578 Residual Multiple R-Squared: 0.6848, 28.97 on 3 and F-statistic: www 0.0816- 0.1826 0.0120. on 40 degrees of freedom Adjusted R-squared: 0.6612 40 DF, p-value: 4.017e-10 nd 10 Quality 5 4-0 Rain 3 2 27 20 6 Rain at Harvest? o No A Yes 0 25 (Intercept) 6.14633 EndofHarvest -0.05723 -1.62219 A 60 AA 0440 41 26.9454 40 22.9705 44 30 35 40 45 End of Harvest (in days since August 31) Figure 5.8 A scatter plot of Quality versus End of Harvest for Chateau Latour A Call: Im(formula = Quality - EndofHarvest + Rain) Coefficients: 1 Analysis of Variance Table Model 1: Quality - EndofHarvest Rain Model 2: Quality - Endof Harvest Res.DE RSS Df Sum of Sq O D 00 00 AAAA 3.9749 O Estimate Std. Error t value Pr(> [t]) 0.61896 9.930 1.800-12 -3.660 0.01564 0.000713 0.25478 -6.367 1.30e-07 50 Residual standard error: 0.8107 on 41 degrees of freedom Multiple R-Squared: 0.6303, Adjusted R-squared: 0.6123 F-statistic: 34.95 on 2 and 41 DF. p-value: 1.383e-09 44 55 Rain + Rain: EndofHarvest F Pr (>P) 6.9218 0.01203 Chateau Latour is widely acknowledged as one of the world's greatest wine estates with a rich history dating back to at least 1638. The Grand Vin de Chateau Latour is a wine of incredible power and longevity. At a tasting in New York in April 2000, the 1863 and 1899 vintages of Latour were rated alongside the 1945 and the 1961 vintages as the best in a line-up of 39 vintages ranging from 1863 to 1999 (Wine Spectator, August 31, 2000). Quality of a particular vintage of Chateau Latour has a huge impact on price. For example, in March 2007, the 1997 vintage of Chateau Latour could be purchased for as little as $159 per bottle while the 2000 vintage of Chateau Latour costs as least $700 per bottle (www.wine-searcher.com). While many studies have identified that the timing of the harvest of the grapes has an important effect on the quality of the vintage, with quality improving the earlier the harvest. A less explored issue of interest is the effect of unwanted rain at vintage time on the quality of icon wine like Chateau Latour. This question addresses this issue. The Chateau Latour web site (www.chateau-latour.com) provides a tich source of data. In particular, data on the quality of each vintage, harvest dates and weather at harvest time were obtained from the site for the vintages from 1961 to 2004. An example of the information on weather at harvest time is given below for the 1994 vintage: Harvest began on the 13th September and lasted on the 29th, frequently interrupted by storm showers. But quite amazingly the dilution effect in the grapes was very limited... (http://www.chateau-latour.com/commentaires/1994uk.html"; Accessed: March 16, 2007) Each vintage was classified as having had "unwanted rain at harvest" (c.g., the 1994 vintage) or not (e.g., the 1996 vintage) on the basis of information like that reproduced above. Thus, the data consist of: Vintage = year the grapes were harvested Quality - on a scale from 1 (worst) to 5 (best) with some half points End of harvest - measured as the number days since August 31 Rain a dummy variable for unwanted rain at harvest = 1 if yes. The data can be found on the book web site in the file latour.csv. The first model considered was: (5.10) A plot of the data and the two regression lines from model (5.10) can be found in Figure 5.8. In addition, numerical output appears below. Quality = B, + B, End of Harvest + B, Rain + B, End of Harvest x Rain + e (a) Show that the coefficient of the interaction term in model (5.10) is statisti- cally significant. In other words, show that the rate of change in quality rat- ing depends on whether there has been any unwanted rain at vintage. (b) Estimate the number of days of delay to the end of harvest it takes to decrease the quality rating by 1 point when there is: (i) No unwanted rain at harvest (ii) Some unwanted rain at harvest Regression output from R Call: 1m (formula = Quality - EndofHarvest+ Rain Rain: Endof Harvest) Coefficients: Estimate 5.16122 -0.03145 1.78670 EndofHarvest: Rain -0.08314 (Intercept) EndofHarvest Rain Std. Error t value Pr(>/t/) 0.68917 7.489 3.95e-09 0.01760 -1.787 1.31740 0.03160 1.356 -2.631 standard error: 0.7578 Residual Multiple R-Squared: 0.6848, 28.97 on 3 and F-statistic: www 0.0816- 0.1826 0.0120. on 40 degrees of freedom Adjusted R-squared: 0.6612 40 DF, p-value: 4.017e-10 nd 10 Quality 5 4-0 Rain 3 2 27 20 6 Rain at Harvest? o No A Yes 0 25 (Intercept) 6.14633 EndofHarvest -0.05723 -1.62219 A 60 AA 0440 41 26.9454 40 22.9705 44 30 35 40 45 End of Harvest (in days since August 31) Figure 5.8 A scatter plot of Quality versus End of Harvest for Chateau Latour A Call: Im(formula = Quality - EndofHarvest + Rain) Coefficients: 1 Analysis of Variance Table Model 1: Quality - EndofHarvest Rain Model 2: Quality - Endof Harvest Res.DE RSS Df Sum of Sq O D 00 00 AAAA 3.9749 O Estimate Std. Error t value Pr(> [t]) 0.61896 9.930 1.800-12 -3.660 0.01564 0.000713 0.25478 -6.367 1.30e-07 50 Residual standard error: 0.8107 on 41 degrees of freedom Multiple R-Squared: 0.6303, Adjusted R-squared: 0.6123 F-statistic: 34.95 on 2 and 41 DF. p-value: 1.383e-09 44 55 Rain + Rain: EndofHarvest F Pr (>P) 6.9218 0.01203
Expert Answer:

Related Book For 

Thermodynamics An Interactive Approach
ISBN: 978-0130351173
1st edition
Authors: Subrata Bhattacharjee
Posted Date:
Students also viewed these mathematics questions
-
In 2008, citing Goldman as one of the Top 20 Most admired Companies in the United States, Fortune magazine characterized the firms culture as an impossible-to-replicate mix of extreme aggression,...
-
In the 1980s Japan was viewed as one of the world's most dynamic economies. Today it is viewed as one of its most stagnant. Why has the Japanese economy stagnated?
-
The Retraction Controversy Imagine yourself as one of the eyewitnesses in the last remaining hour of Dr. Jose Rizal on earth. If Dr. Jose Rizal were to withdraw his claims about the Catholic Church...
-
Austin Limited is trying to determine the value of its ending inventory as of February 28, 2019, the companys year-end. The following transactions occurred, and the accountant asked your help in...
-
With the growing popularity of casual surf print clothing, two recent MBA graduates decided to broaden this casual surf concept to encompass a surf lifestyle for the home. With limited capital, they...
-
In a system with a high degree of concurrency, what role do locks, mutexes, and semaphores play in managing thread synchronization, and how do these mechanisms impact the scalability and reliability...
-
Find the z-score that has 31.5% of the distributions area to its left. Find the indicated z-score.
-
Eureka Limited has a calendar-year accounting period. The following errors were discovered in 2014. 1. The December 31, 2012 merchandise inventory had been understated by $51,000. 2. Merchandise...
-
Partial adjusted trial balance for Metlock, Inc. at December 31, 2022, includes the following accounts: Retained Earnings $17,300. Dividends $4,800, Service Revenue $37,300, Salaries and Wages...
-
Explain why errors in the valuation of inventory at the end of the year are sometimes called counterbalancing or self-correcting.
-
Today, everyday objects are being embedded with hardware that can sense, process, and transmit data. Connecting these objects to the Internet is leading to ________.
-
Compare the gravitational force on a 42.5 kg mass at the surface of the Earth (with radius 6.4 106 m and mass 6 1024 kg) with that on the surface of the Moon (with mass 1 ME and radius 0.27 RE)....
-
Planck time. The smallest time interval defined in physics is the Planck time tp = 5.39 x 10-44 s, which is the time required for light to travel across a certain length in a vacuum. The universe...
-
Mr. Fox, a single taxpayer, recognized a $64,000 long-term capital gain, a $14,300 short-term capital gain, and a $12,900 long-term capital loss. Required: Compute Mr. Fox's income tax and Medicare...
-
A is a Web application that combines services from two or more sources, creating a new application. a . document management system b . peer - to - peer network c . Web service d . mashup
-
Choose the statement below that describes what the following lines of code does (assume all necessary import statements are in place): String name "Input1.txt"; File f new File(name); PrintStream...
-
How much more has beeen spent on large cars than executive cars? B: What is the average number of business kilometers travelled each year? C: What is the annual tax payment for an employee at the 40%...
-
Consider the sections of two circuits illustrated above. Select True or False for all statements.After connecting a and b to a battery, the voltage across R1 always equals the voltage across R2.Rcd...
-
A cup of coffee is heated in a microwave oven. If the mass of coffee (modeled as liquid water) is 0.2 kg and the rate of heat transfer is 0.1 kW. (a) Determine the rate of change of internal energy...
-
Saturated steam at 40oC is to be cooled to saturated liquid in a condenser. If the mass flow rate of the steam is 20 kg/s, Determine the rate of heat transfer in MW. Assume no pressure loss.
-
An ideal-gas refrigeration cycle uses air as the working fluid to maintain a refrigerated space at -30oC while rejecting heat to the surrounding medium at 30oC. If the pressure ratio of the...
-
Consider the flow of a perfect gas along a Fanno line. Show that the pressure at the * reference state is given by the relation 1/2 m 2RT, P Ayge(y+1)
-
Air flows in an 8-cm-inside diameter pipe that is \(4 \mathrm{~m}\) long. The air enters with a Mach number of 0.45 and a temperature of \(300 \mathrm{~K}\). (a) What friction factor would cause...
-
Air enters a duct with a mass flow rate of \(35 \mathrm{lbm} / \mathrm{sec}\) at \(T_{1}=520^{\circ} \mathrm{R}\) and \(p_{1}=20 \mathrm{psia}\). The duct is square and has an area of \(0.64...
Accounting Ledger Book With Yearly Financial Planning And Notes Pages - ISBN: B0CDZ2D6ZX - Free Book

Study smarter with the SolutionInn App