

Question: ChatGPT Lab 5 - - Economic Order C Take Quiz 1 4 Math Emporium Assessm ssessment.emporium.vt . edu: 8 4 4 3 / assessment /
ChatGPT
Lab Economic Order C
Take Quiz
Math Emporium Assessm
ssessment.emporium.vtedu:assessmentwicketpageIFormSubmitListeneritemPanelitemForm
MATH LS
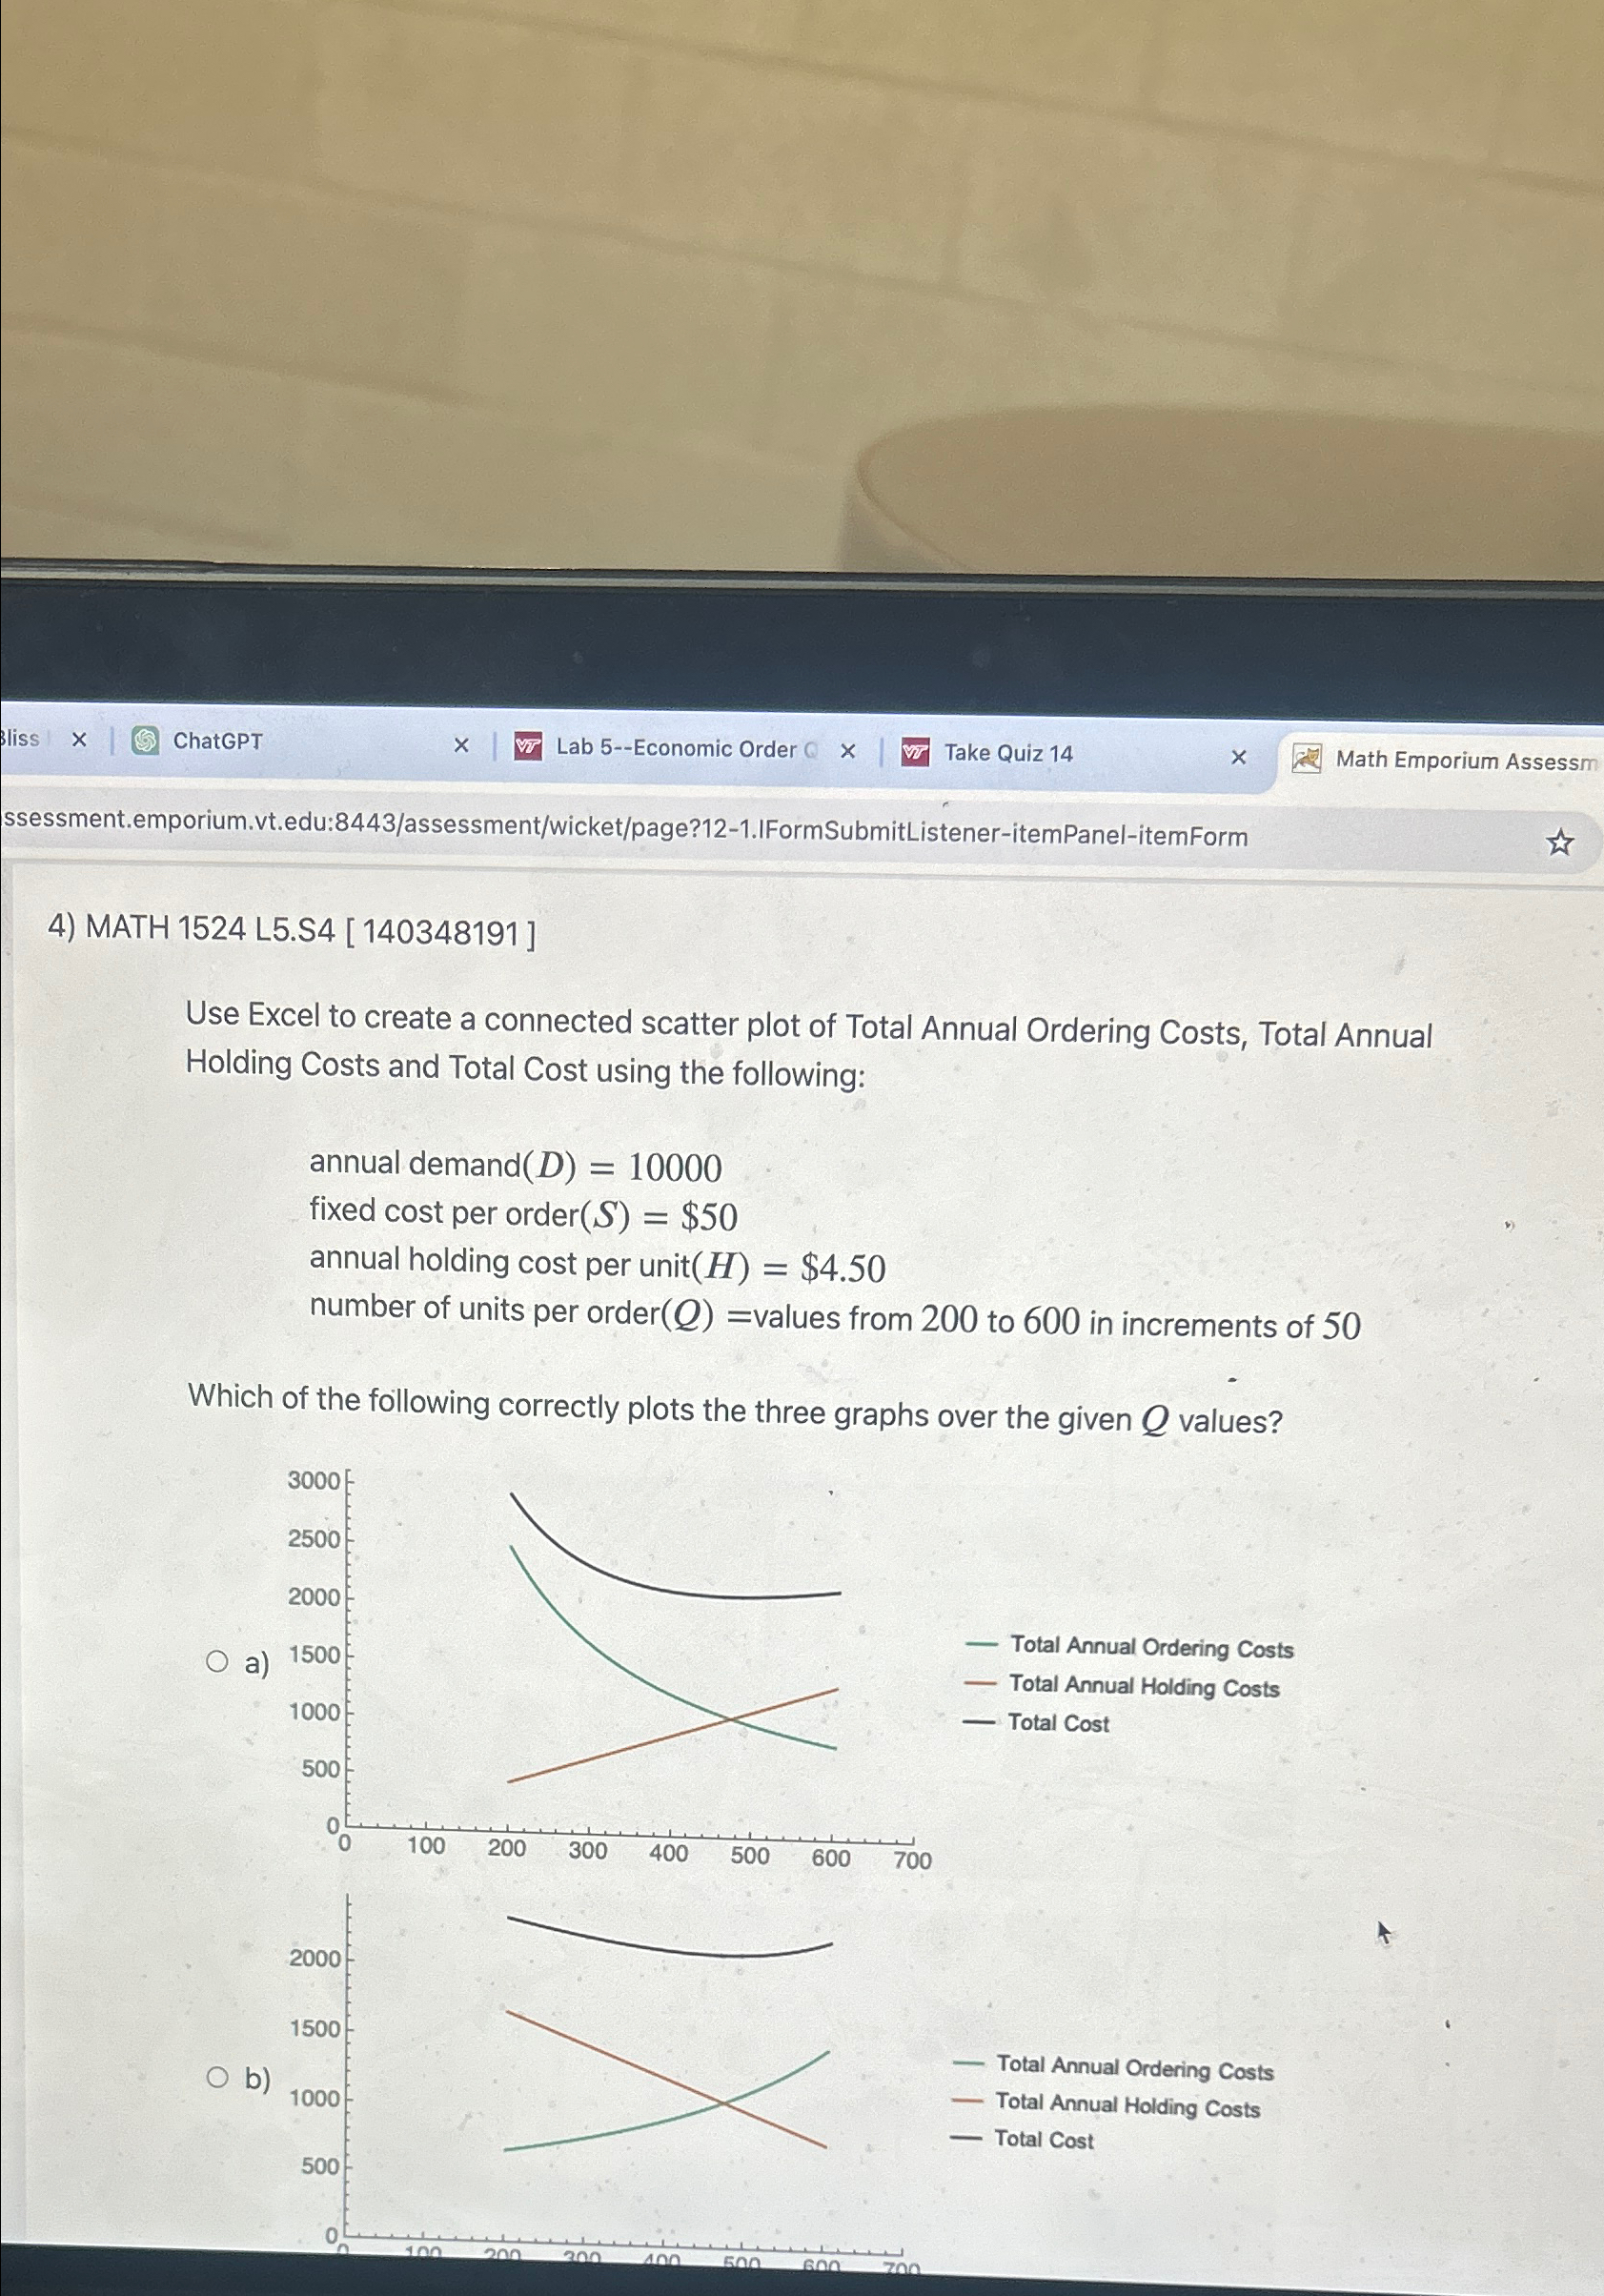
Use Excel to create a connected scatter plot of Total Annual Ordering Costs, Total Annual Holding Costs and Total Cost using the following:
annual demand
fixed cost per order$
annual holding cost per unit $
number of units per order values from to in increments of
Which of the following correctly plots the three graphs over the given values?
a
Total Annual Ordering Costs
Total Annual Holding Costs
Total Cost
b
Step by Step Solution
There are 3 Steps involved in it
1 Expert Approved Answer
Step: 1 Unlock

Question Has Been Solved by an Expert!
Get step-by-step solutions from verified subject matter experts
Step: 2 Unlock
Step: 3 Unlock