

Question: Check 2 Exercise 13-4 Common-size percent computation and interpretation LO P2 Express the following comparative income statements in common-size percents. (Round your percentage answers to
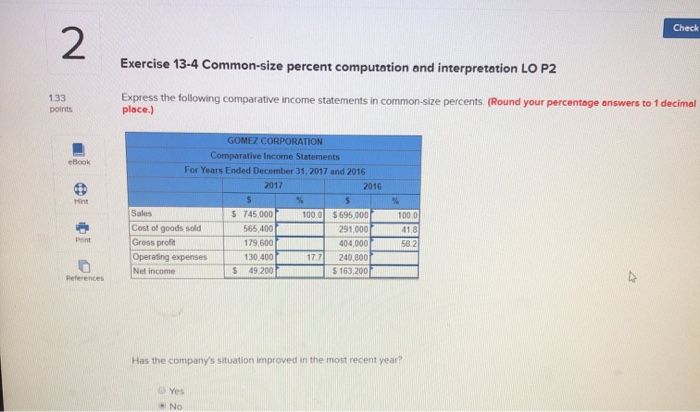
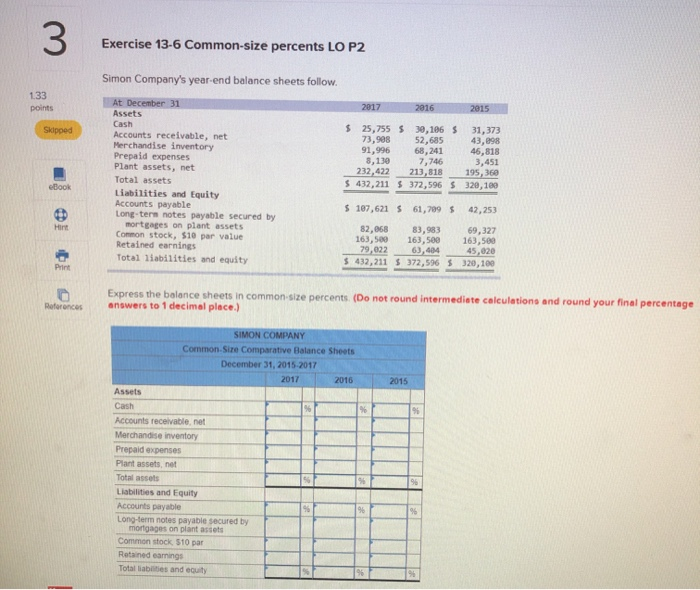
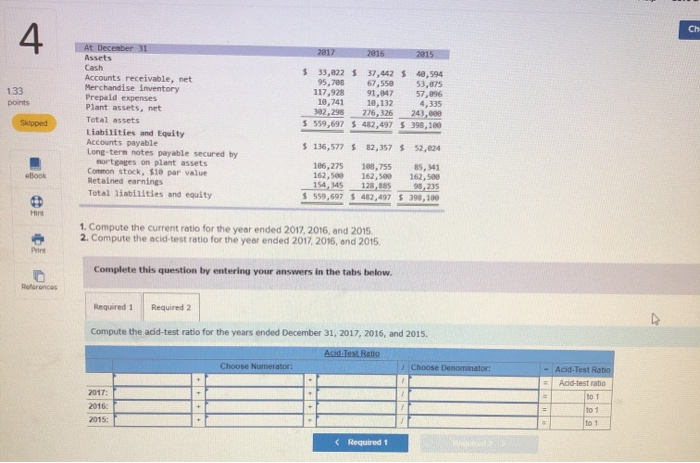
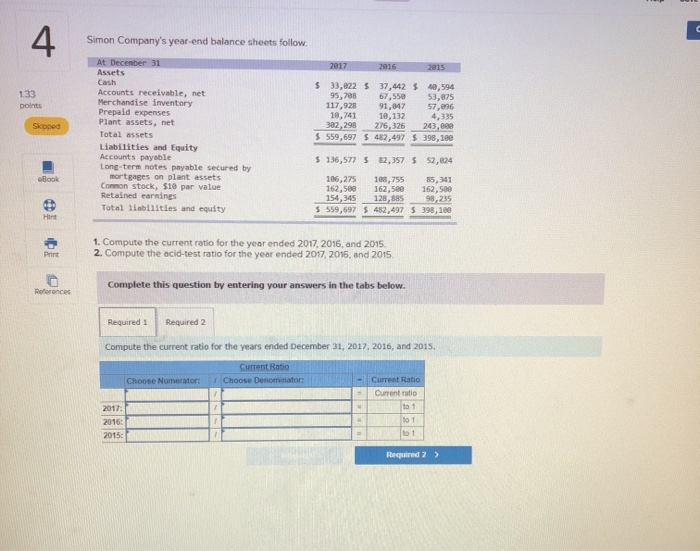
Check 2 Exercise 13-4 Common-size percent computation and interpretation LO P2 Express the following comparative income statements in common-size percents. (Round your percentage answers to 1 decimal place.) 133 points GOMEZ CORPORATION Comparative Income Statements eBook For Years Ended December 31, 2017 and 2016 2017 2016 % % Hint S 745,000 Sales 100.0 $695,000 100 0 Cost of goods sold 291,000 404,000 240,800 565,400 41.8 Print Gress profit 179,600 58 2 Operating expenses Net income 130 400 17.7 S 49,200 $ 163.200 References Has the company's situation improved in the most recent year? Yes No 33 Exercise 13-6 Common-size percents LO P2 Simon Company's year-end balance sheets follow 1.33 points At December 31 2017 2016 2015 Assets Cash $ 25,755 30,106 73,908 91,996 8,130 232,422 Skipped 31,373 43,898 46,818 Accounts receivable, net Merchandise inventory Prepaid expenses Plant assets, net 52,685 68,241 7,746 213,818 $ 432,211 $ 372,596 320,180 3,451 195, 360 Total assets eBook Liabilities and Equity Accounts payable Long-term notes payable secured by mortgages on plant assets Common stock, $10 par value Retained earnings Total liabilities and equity $ 107,621 61,709 42,253 Hirt 82,068 163,500 79,022 83,983 163,500 63,484 $ 432,211 372,596 320,100 69,327 163,500 45,020 Print Express the balance sheets in common-size percents. (Do not round intermediete calculations and round your final percentage answers to 1 decimal place.) Refarences SIMON COMPANY Common-Size Comparative Balance Sheets December 31, 2015-2017 2017 2016 2015 Assets Cash Accounts receivable, net Merchandise inventory Prepaid expenses Plant assets, net Total assets 96 96 Liabilities and Equity Accounts payable % Long-term notes payable secured by mortgages on plant assets Common stock $10 par Retained earnings Total liabiities and equity 4 Chi At December 31 2817 2816 2815 Assets Cash Accounts receivable, net Merchandise imventory Prepald expenses Plant assets, net S 33,822 95,708 117,928 10,741 302,298 37,442 40,594 67,550 91,047 53,875 57,096 4,335 243,000 133 points 1e,132 276,326 $ 559,697 482,497 398,100 Total assets Skipped Liabilities and Equity Accounts payable Long-term notes payable secured by nortgages on plant assets Common stock, $10 par value Retained earnings Total liabilities and equity $ 136,577 82,357 52,024 106,275 108,755 162,s00 128,885 S 559,697 482,497 398,100 85, 341 162,500 98,235 eBook 162,500 154, 345 Hint 1. Compute the current ratio for the year ended 2017, 2016, and 2015 2. Compute the acid-test ratio for the year ended 2017, 2016, and 2015 Prire Complete this question by entering your answers in the tabs below. Refarences Required 1 Required 2 Compute the acid-test ratio for the years ended December 31, 2017, 2016, and 2015. Acid Test Ratio Choose Numerator: Choose Denominator -Acid-Test Ratio Acid-test ratio 2017 to 1 2016 to 1 2015 to 1
Step by Step Solution
There are 3 Steps involved in it

Get step-by-step solutions from verified subject matter experts