

Question: Check My Work eBook Problem Walk-Through A stock's returns have the following distribution: Demand for the Probability of this Rate of Return if Company's Products
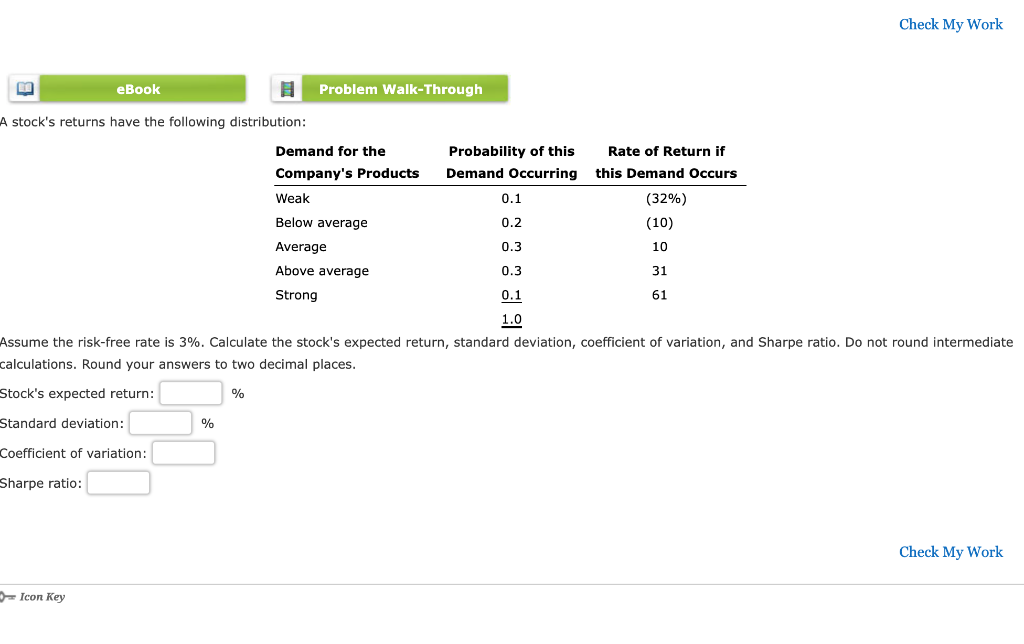
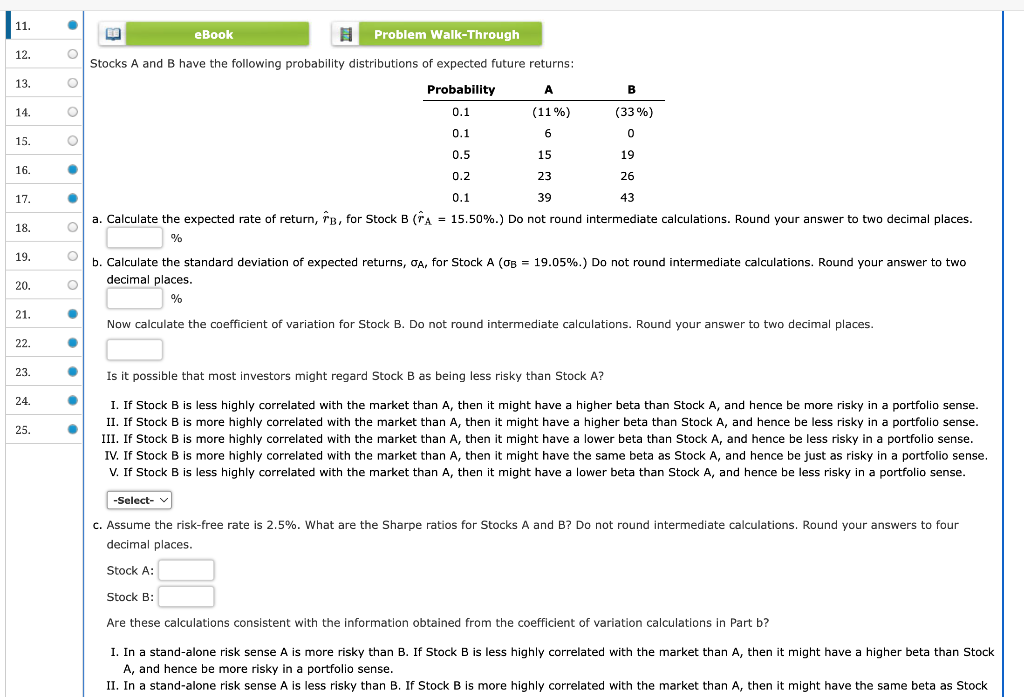
Check My Work eBook Problem Walk-Through A stock's returns have the following distribution: Demand for the Probability of this Rate of Return if Company's Products Demand Occurring this Demand Occurs Weak 0.1 (32%) Below average 0.2 (10) Average 0.3 10 Above average 0.3 31 Strong 0.1 61 1.0 Assume the risk-free rate is 3%. Calculate the stock's expected return, standard deviation, coefficient of variation, and Sharpe ratio. Do not round intermediate calculations. Round your answers to two decimal places. Stock's expected return: % Standard deviation: % Coefficient of variation: Sharpe ratio: Check My Work Icon Key 11. eBook Problem Walk-Through 12. a Stocks A and B have the following probability distributions of expected future returns: 13. B Probability 0.1 14. (11%) (33%) %) 0.1 6 0 15. O 0.5 15 19 16. . 17. 18. 0.2 23 26 0.1 39 43 a. Calculate the expected rate of return, FB, for Stock B (A = 15.50%.) Do not round intermediate calculations. Round your answer to two decimal places. % b. Calculate the standard deviation of expected returns, OA, for Stock A (OB = 19.05%.) Do not round intermediate calculations. Round your answer to two decimal places. % 19. o 20. O 21. Now calculate the coefficient of variation for Stock B. Do not round intermediate calculations. Round your answer to two decimal places. 22 23. . Is it possible that most investors might regard Stock B as being less risky than Stock A? 24. m 25. I. If Stock B is less highly correlated with the market than A, then it might have a higher beta than Stock A, and hence be more risky in a portfolio sense. II. If Stock B is more highly correlated with the market than A, then it might have a higher beta than Stock A, and hence be less risky in a portfolio sense. III. If Stock B is more highly correlated with the market than A, then it might have a lower beta than Stock A, and hence be less risky in a portfolio sense. IV. If Stock B is more highly correlated with the market than A, then it might have the same beta as Stock A, and hence be just as risky in a portfolio sense. V. If Stock B is less highly correlated with the market than A, then it might have a lower beta than Stock A, and hence be less risky in a portfolio sense. -Select- C. Assume the risk-free rate is 2.5%. What are the Sharpe ratios for Stocks A and B? Do not round intermediate calculations. Round your answers to four decimal places. Stock A: Stock B: Are these calculations consistent with the information obtained from the coefficient of variation calculations in Part b? m I. In a stand-alone risk sense A is more risky than B. If Stock B is less highly correlated with the market than A, then it might have a higher beta than Stock A, and hence be more risky in a portfolio sense. II. In a stand-alone risk sense A is less risky than B. If Stock B is more highly correlated with the market than A, then it might have the same beta as Stock
Step by Step Solution
There are 3 Steps involved in it

Get step-by-step solutions from verified subject matter experts