

Question: Check my work The table below shows aggregate demand and aggregate supply schedules in a hypothetical economy, Algonquin. whose MFC is equal to 0.20 and

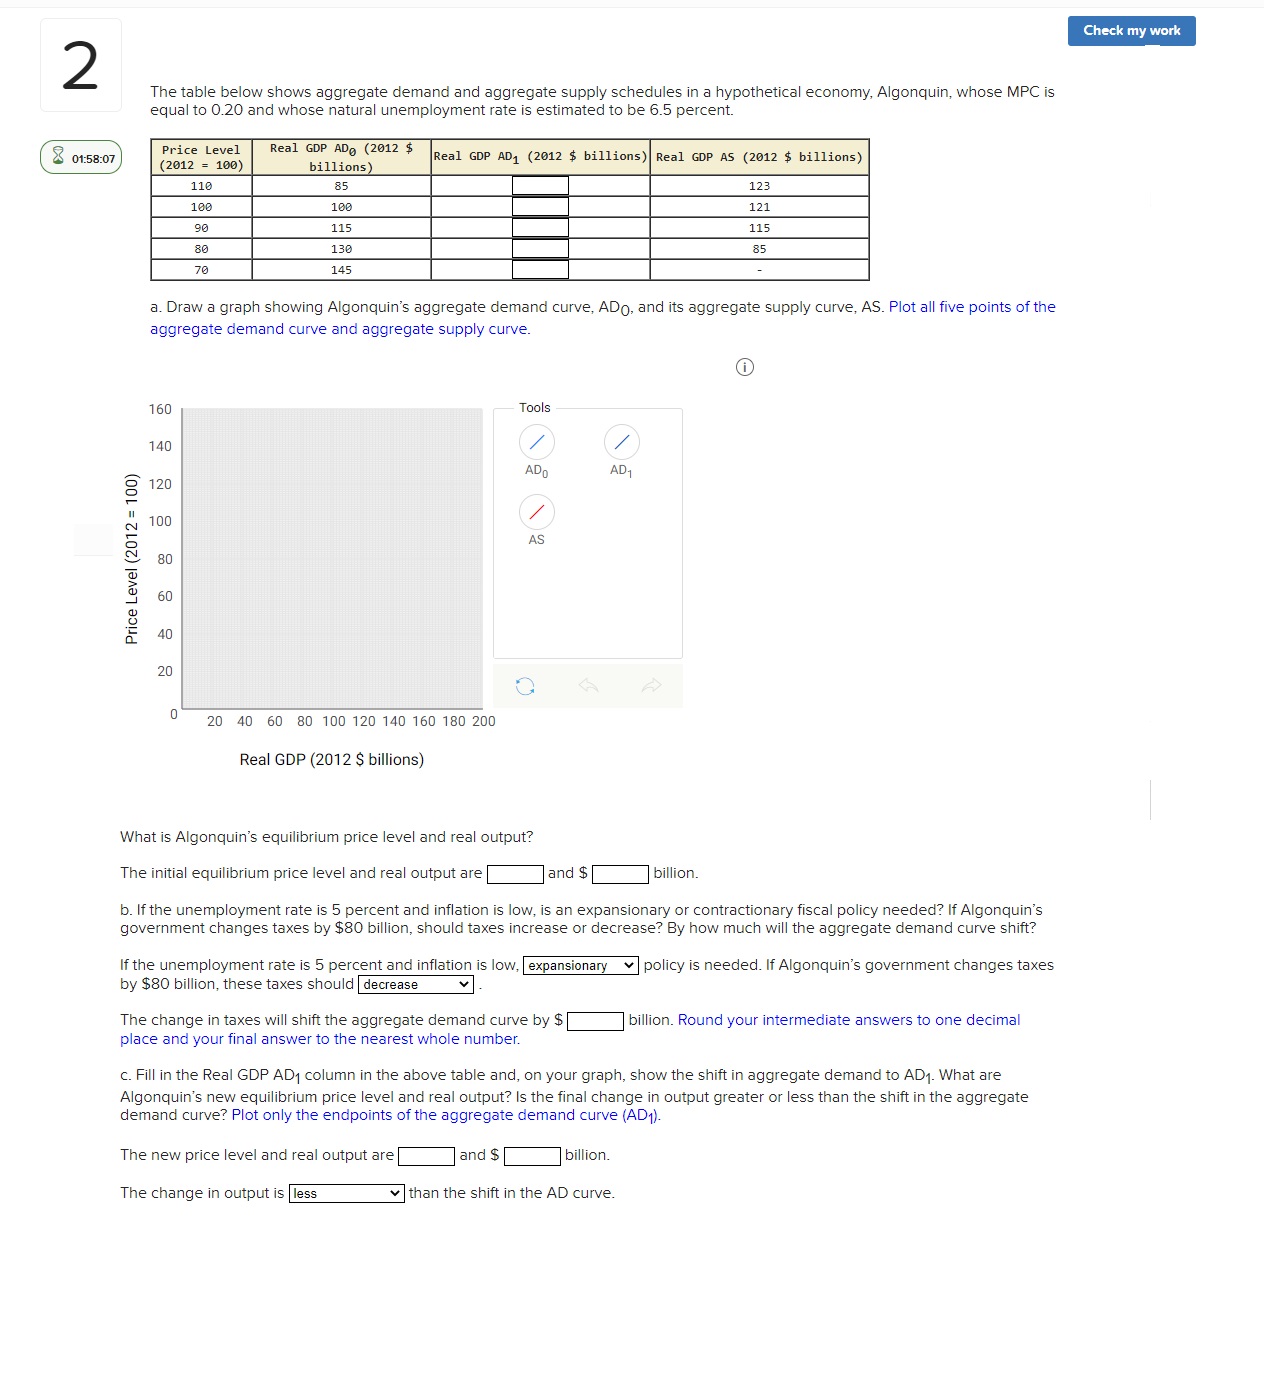
Check my work The table below shows aggregate demand and aggregate supply schedules in a hypothetical economy, Algonquin. whose MFC is equal to 0.20 and whose natural unemployment rate is estimated to be 6.5 percent. Price Level R231 GJP A03 (2012 $ _ . . . em = m "\"1 \"\"P "'1 (m * Wm) a as m s b.1110...) :=- a. Draw a graph showing Algonquin's aggregate demand curve, ADD, and its aggregate supply curve, AS. Plot all ve points of the aggregate demand curve and aggregate supply curve. 160 Tools 140 / / ,_. ADD AD1 g 120 ,_ c'i, 100 / 5 AS 9.\". an a 3 _, so 0.1 .2 E 40 20 I\"? k.) 0 20 4O 60 SUTOOT20140160180 200 Real GDP (2012 S billions) What is Algonquin's equilibrium price level and real output? The initial equilibrium price level and real output are and $ billion. b. If the unemployment rate is 5 percent and inflation is low, is an expansionary or contractionary scal policy needed? If Algonquin's government changes taxes by $80 billion, should taxes increase or decrease? By how much will the aggregate demand curve shift? If the unemployment rate is 5 percent and ination is low. expansionary v policy is needed. If Algonquin's governmentchanges taxes by $80 billionvthese taxes should decrease v . The change in taxes will shift the aggregate demand curve by $5 billion. Round your intermediate answers to one decimal place and your final answer to the nearest whole number. c. Fill in the Real GDP AD1 column in the above table and, on your graph, show the shift in aggregate demand to A01. What are Algonquin's new equilibrium price level and real output? Is the final change in output greater or less than the shift in the aggregate demand curve? Plot only the endpoints of the aggregate demand curve (AD. The new price level and real output are and 35 billion. The change in output is less v than the shift in the AD curve
Step by Step Solution
There are 3 Steps involved in it

Get step-by-step solutions from verified subject matter experts