

Question: Check my workCheck My Work button is now enabled1 Item 3 Item 3 10 points Exercise 18-6 Cost behavior estimation-scatter diagram and high-low LO P1
Check my workCheck My Work button is now enabled1
Item 3
Item 3 10 points
Exercise 18-6 Cost behavior estimation-scatter diagram and high-low LO P1
Felix & Co. reports the following information about its unit sales and cost of sales.
| Period | Units Sold | Cost of Sales | Period | Units Sold | Cost of Sales | ||||||||||||||||||
| 1 | 0 | $ | 2,510 | 6 | 2,010 | $ | 6,128 | ||||||||||||||||
| 2 | 410 | 3,248 | 7 | 2,410 | 6,848 | ||||||||||||||||||
| 3 | 810 | 3,968 | 8 | 2,810 | 7,568 | ||||||||||||||||||
| 4 | 1,210 | 4,688 | 9 | 3,210 | 8,288 | ||||||||||||||||||
| 5 | 1,610 | 5,408 | 10 | 3,610 | 9,008 | ||||||||||||||||||
Hint: (Draw an estimated line of cost behavior using a scatter diagram offline.)
Complete the below table to calculate the fixed cost and variable cost of sales by using the high-low method.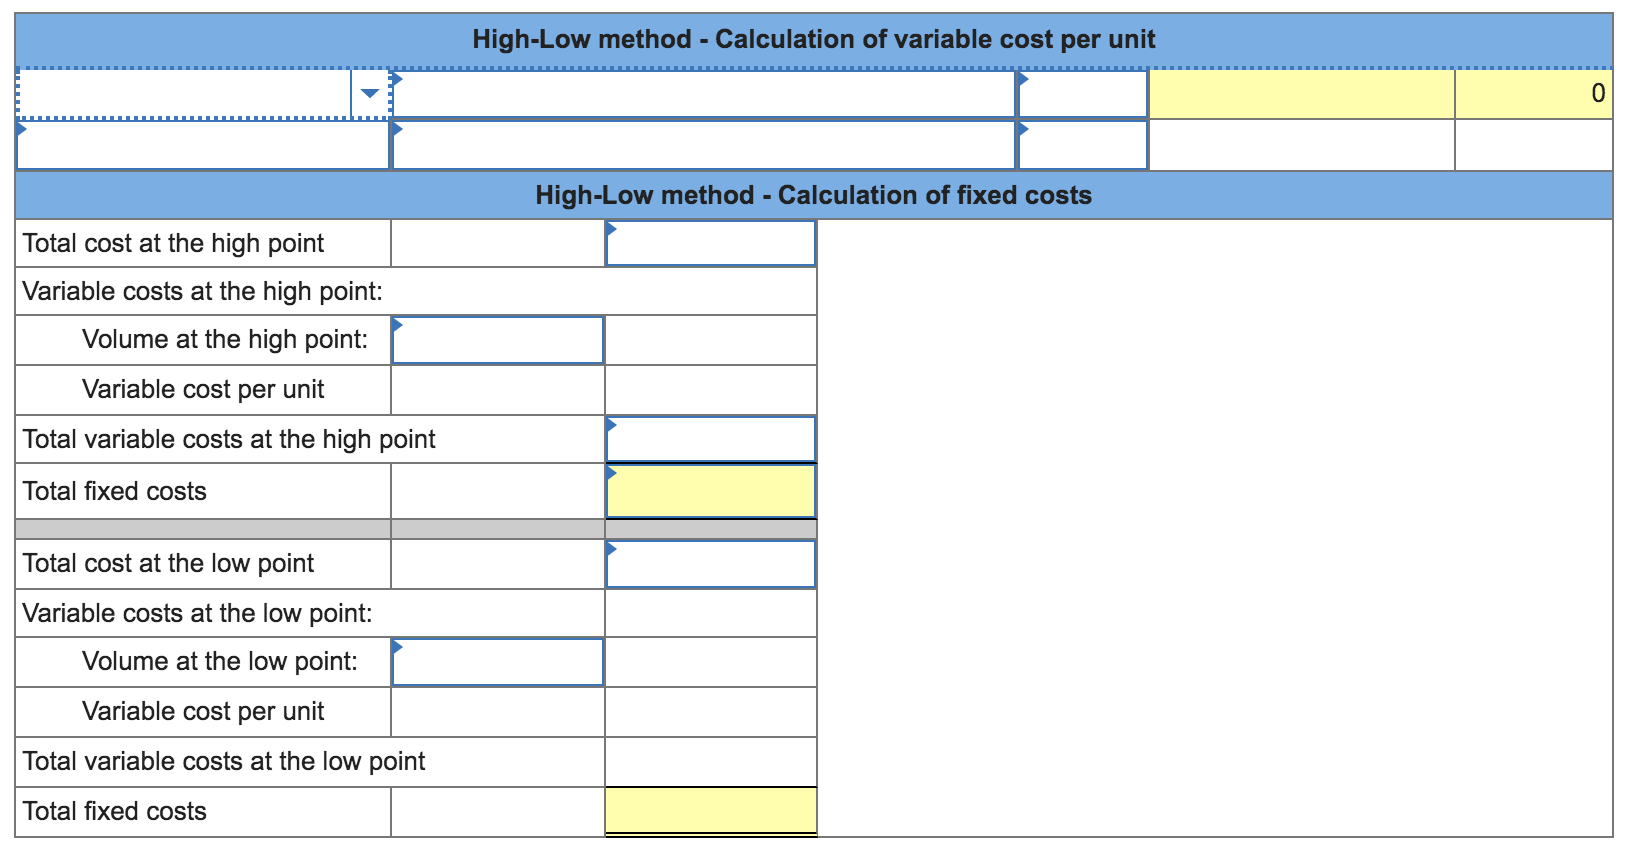
High-Low method - Calculation of variable cost per unit High-Low method - Calculation of fixed costs Total cost at the high point Variable costs at the high point: Volume at the high point: Variable cost per unit Total variable costs at the high point Total fixed costs Total cost at the low point Variable costs at the low point: Volume at the low point: Variable cost per unit Total variable costs at the low point Total fixed costs
Step by Step Solution
There are 3 Steps involved in it

Get step-by-step solutions from verified subject matter experts