

Question: Chi Square Activity An instructor makes out his final grades for 200 students in his introductory statistics class. He is curious to see if his

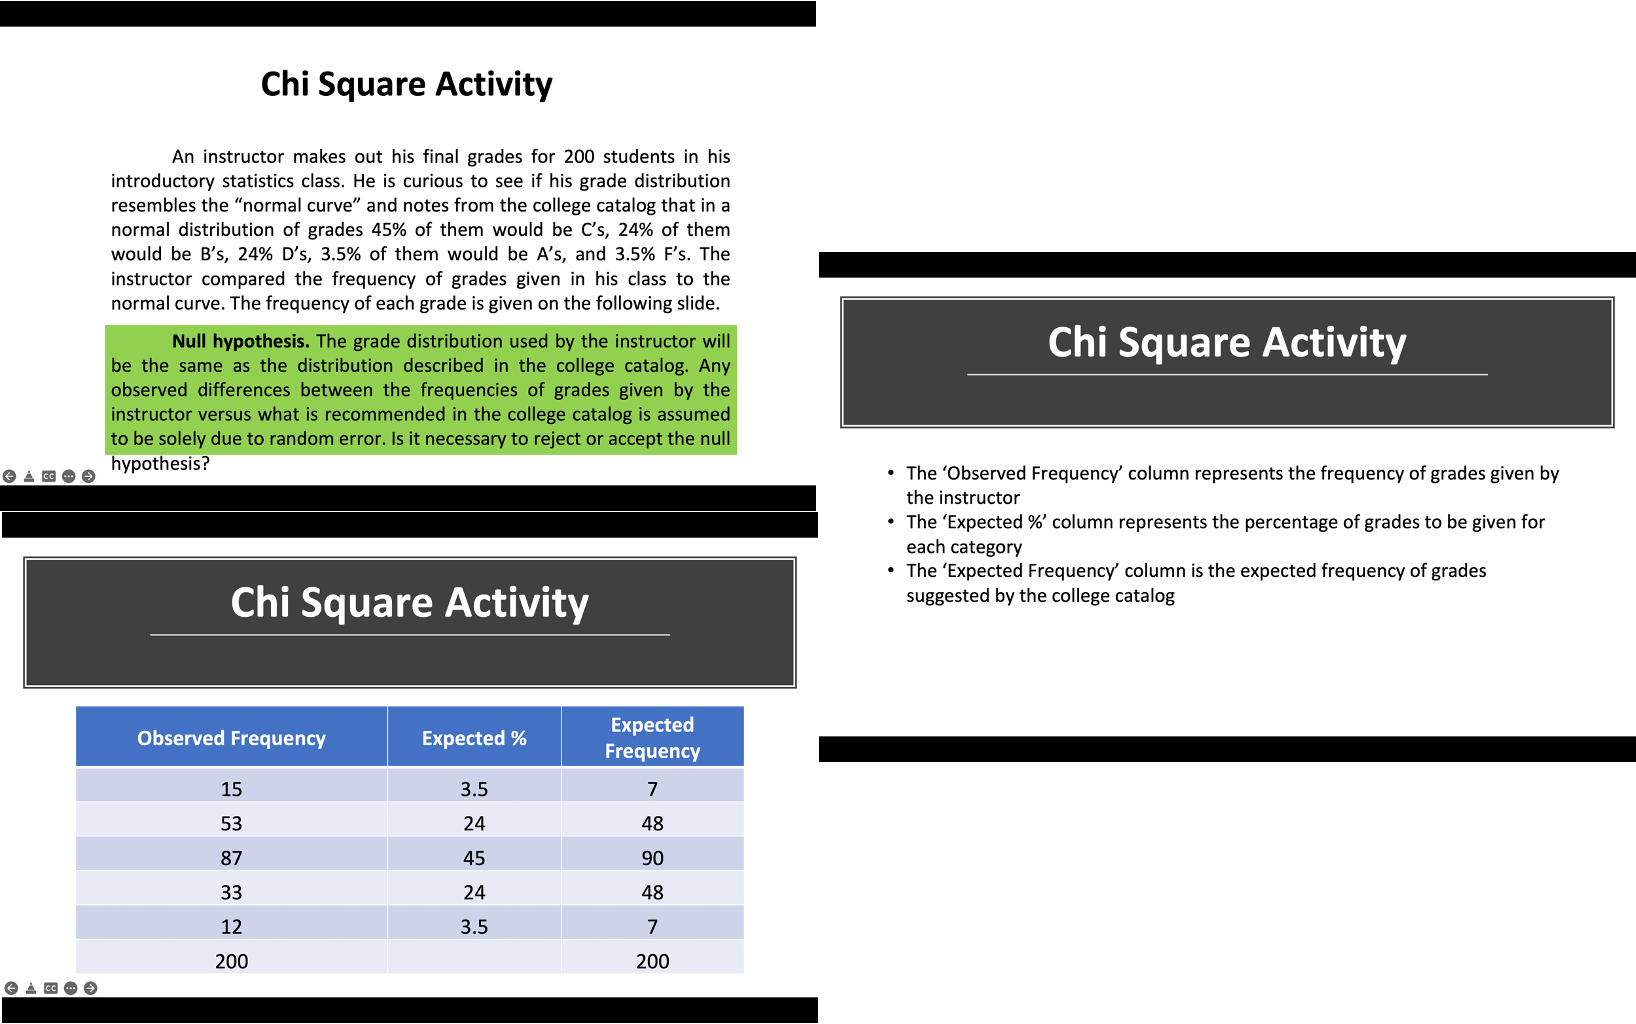
Chi Square Activity An instructor makes out his final grades for 200 students in his introductory statistics class. He is curious to see if his grade distribution resembles the "normal curve" and notes from the college catalog that in a normal distribution of grades 45% of them would be C's, 24% of them would be B's, 24% D's, 3.5% of them would be A's, and 3.5% F's. The instructor compared the frequency of grades given in his class to the normal curve. The frequency of each grade is given on the following slide. Null hypothesis. The grade distribution used by the instructor will be the same as the distribution described in the college catalog. Any Chi Square Activity observed differences between the frequencies of grades given by the instructor versus what is recommended in the college catalog is assumed to be solely due to random error. Is it necessary to reject or accept the null hypothesis? . The 'Observed Frequency' column represents the frequency of grades given by the instructor . The 'Expected %' column represents the percentage of grades to be given for each category . The 'Expected Frequency' column is the expected frequency of grades Chi Square Activity suggested by the college catalog Observed Frequency Expected % Expected Frequency 15 3.5 7 53 24 48 87 45 90 33 24 48 12 3.5 7 200 200
Step by Step Solution
There are 3 Steps involved in it

Get step-by-step solutions from verified subject matter experts