

Question: Chi-Square Tests a.198 cells (100.0%) have expected count less than 5. The minimum expected count is .02.To investigate the correlations between the categorical variables in
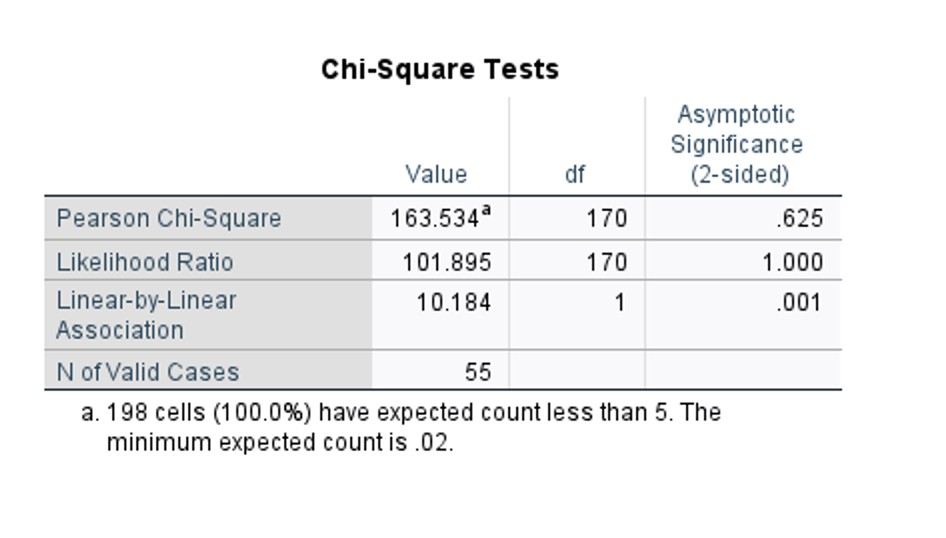
Chi-Square Tests
a.198 cells (100.0%) have expected count less than 5. The
minimum expected count is .02.To investigate the correlations between the categorical variables in mydata, IusedSPSS's CROSSTABS tool. While it's not necessary to investigate every relationship, I need toconsider which one might be the most intriguing or significant. I also need toshare mythoughts about what I saw or observed. I'll share the images of the whole long chart I pulled from my SPSS data. Can you please investigate the correlations between the categorical variables in mydata and consider which one might be the most intriguing or significant. Can you also share the observations. Thank you.
The first four pictures of the table is just split into 4 different pictures because I couldn't screenshot all together. The last image I shared is of the Chi-test square table as well if needed. Thanks.
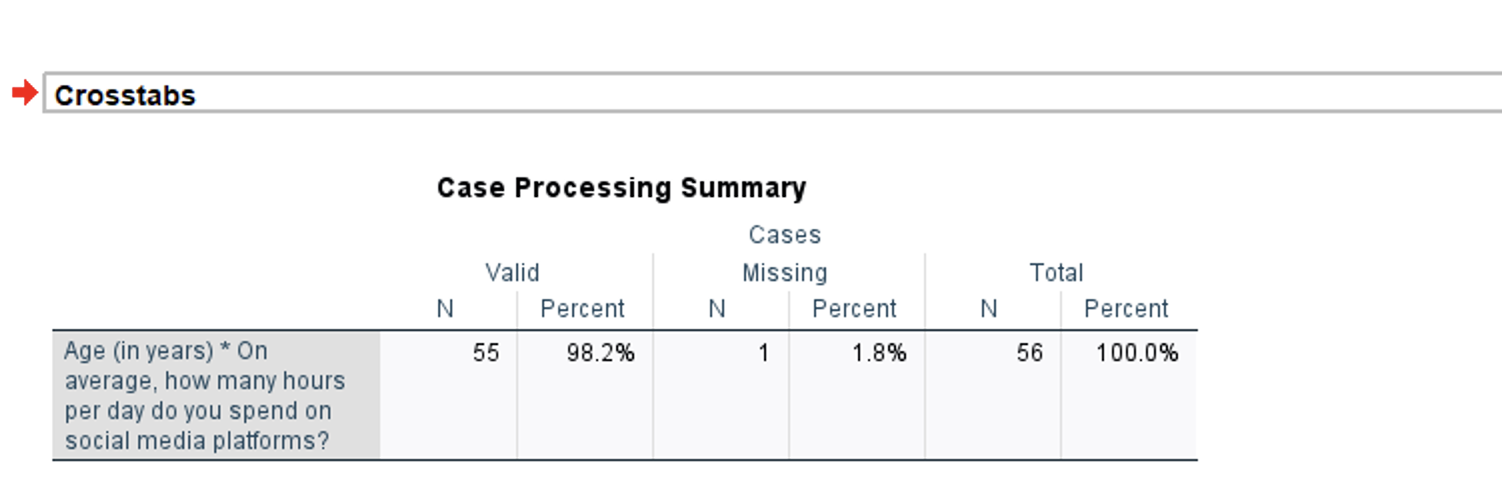
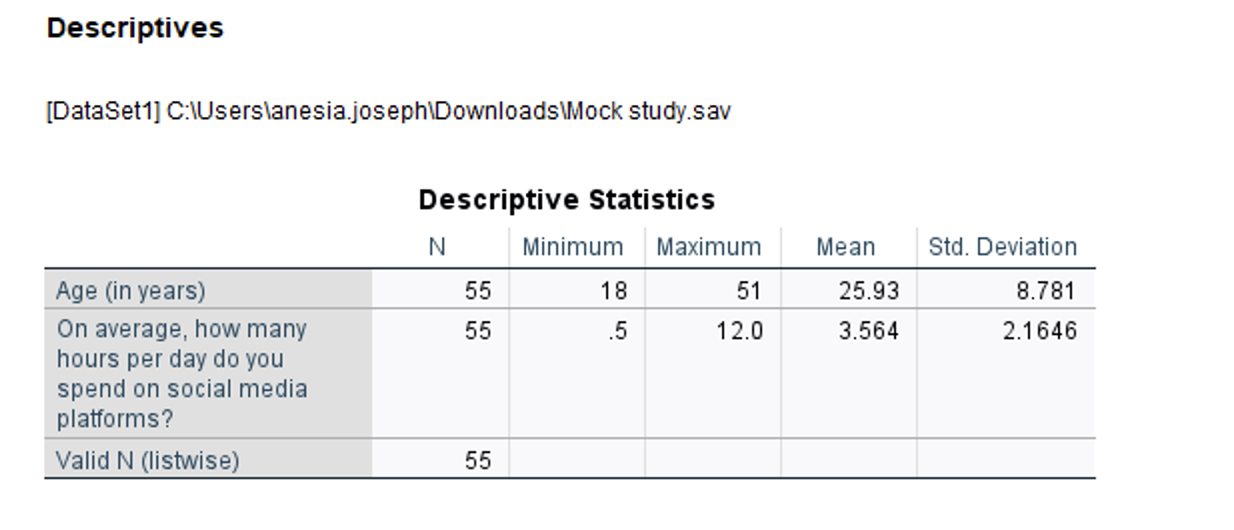
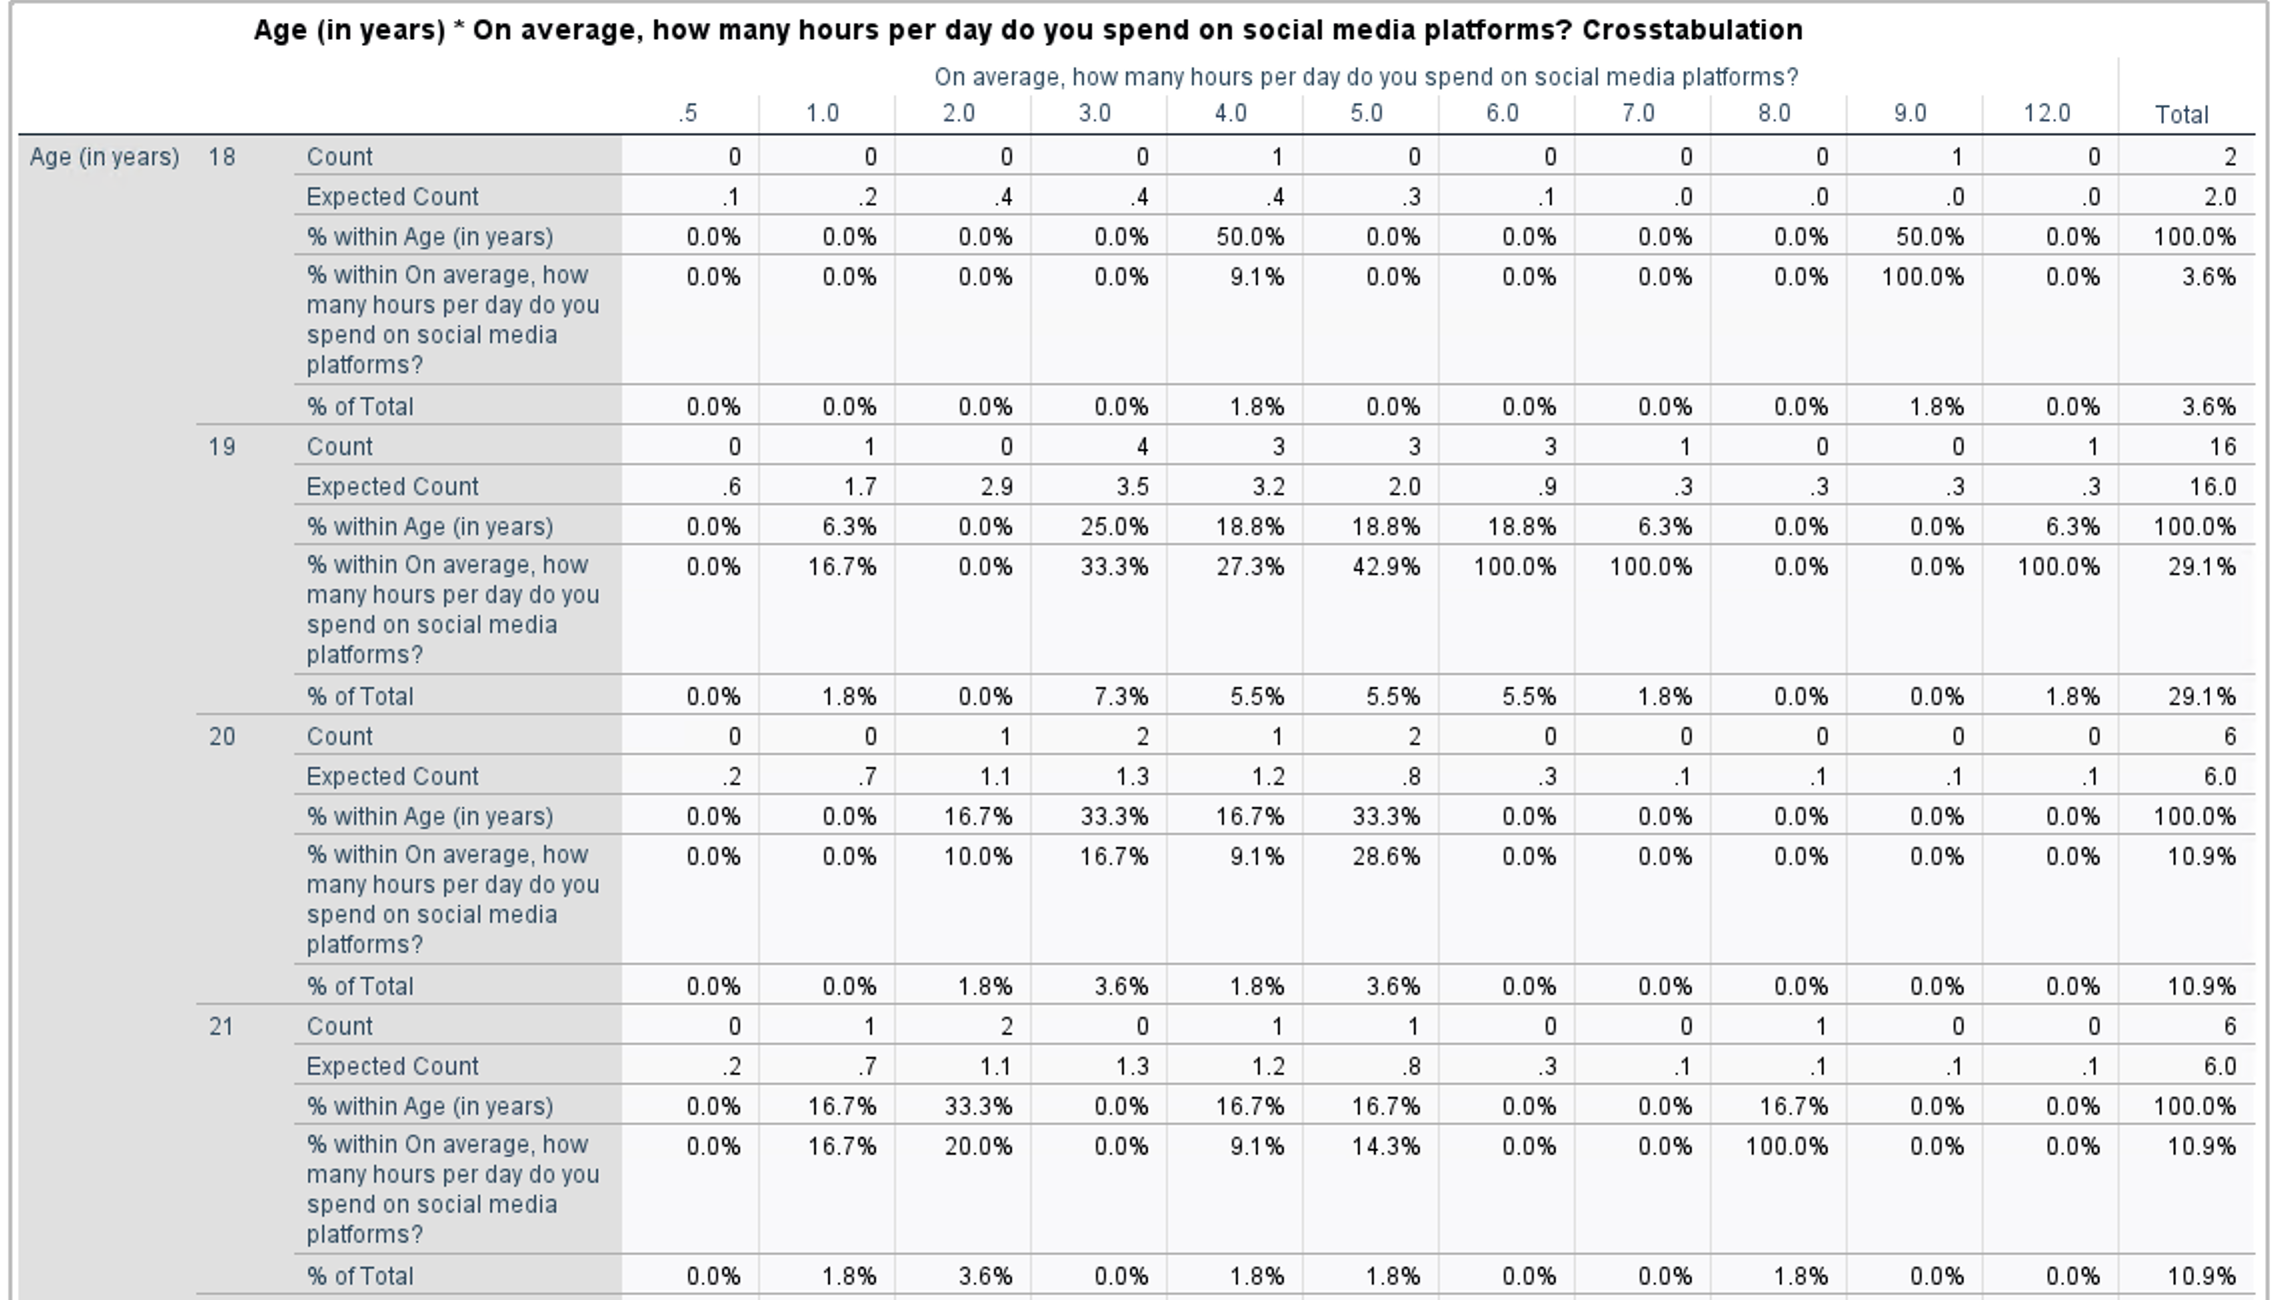
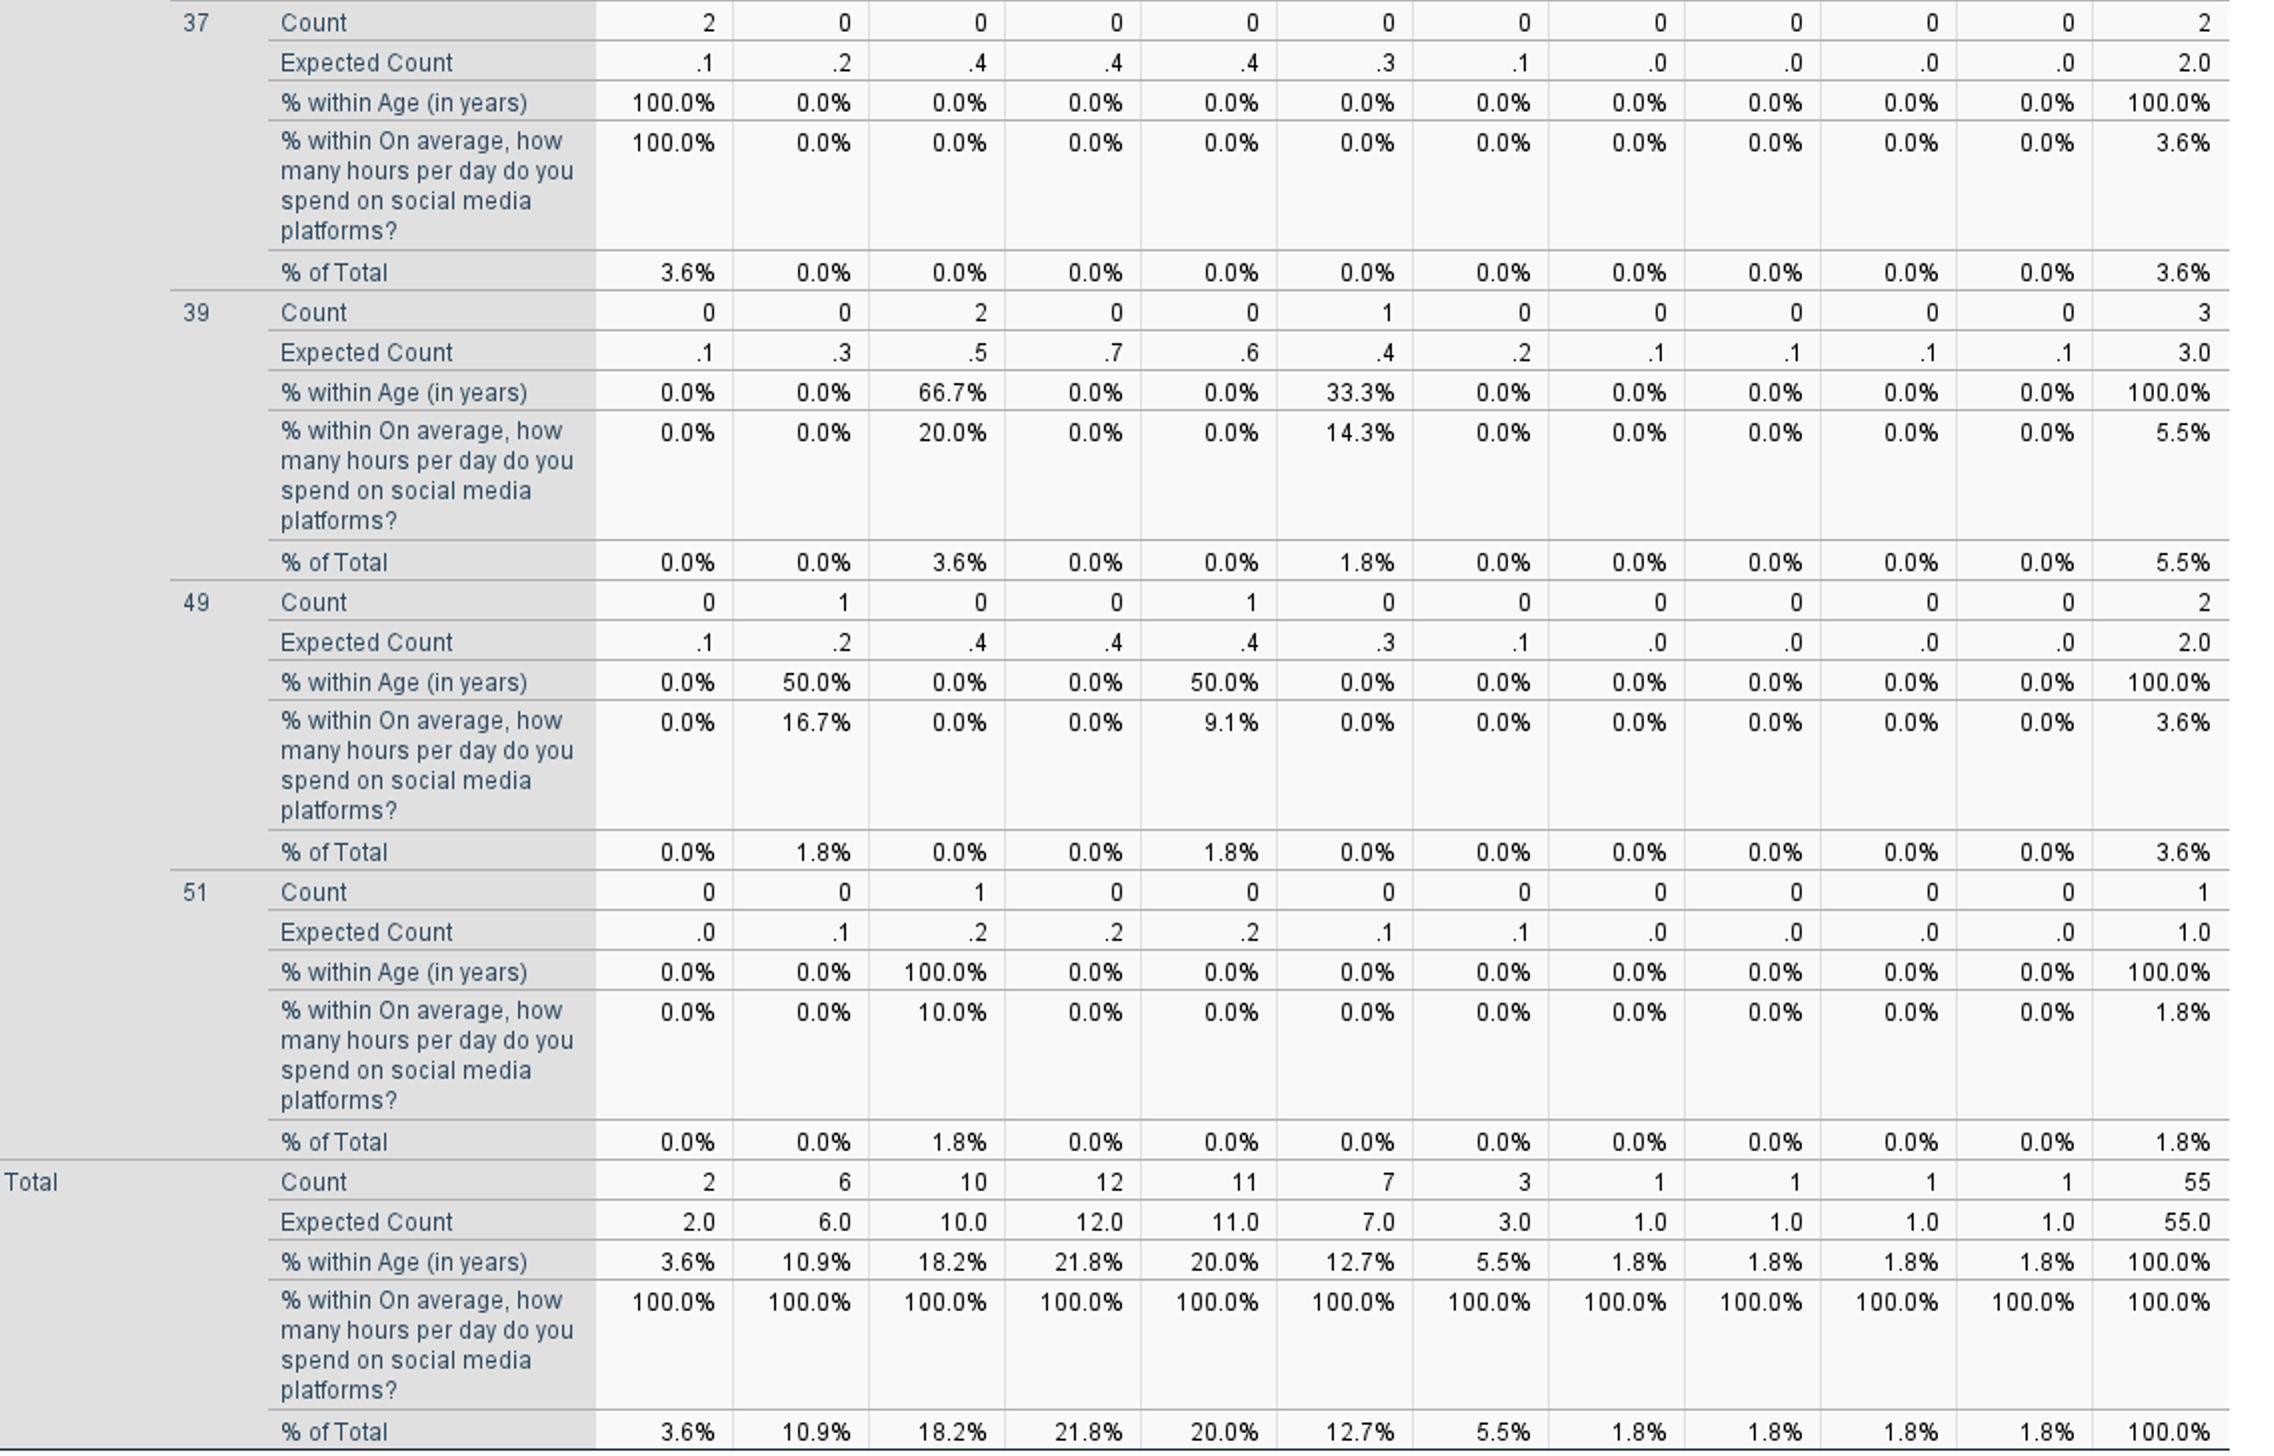
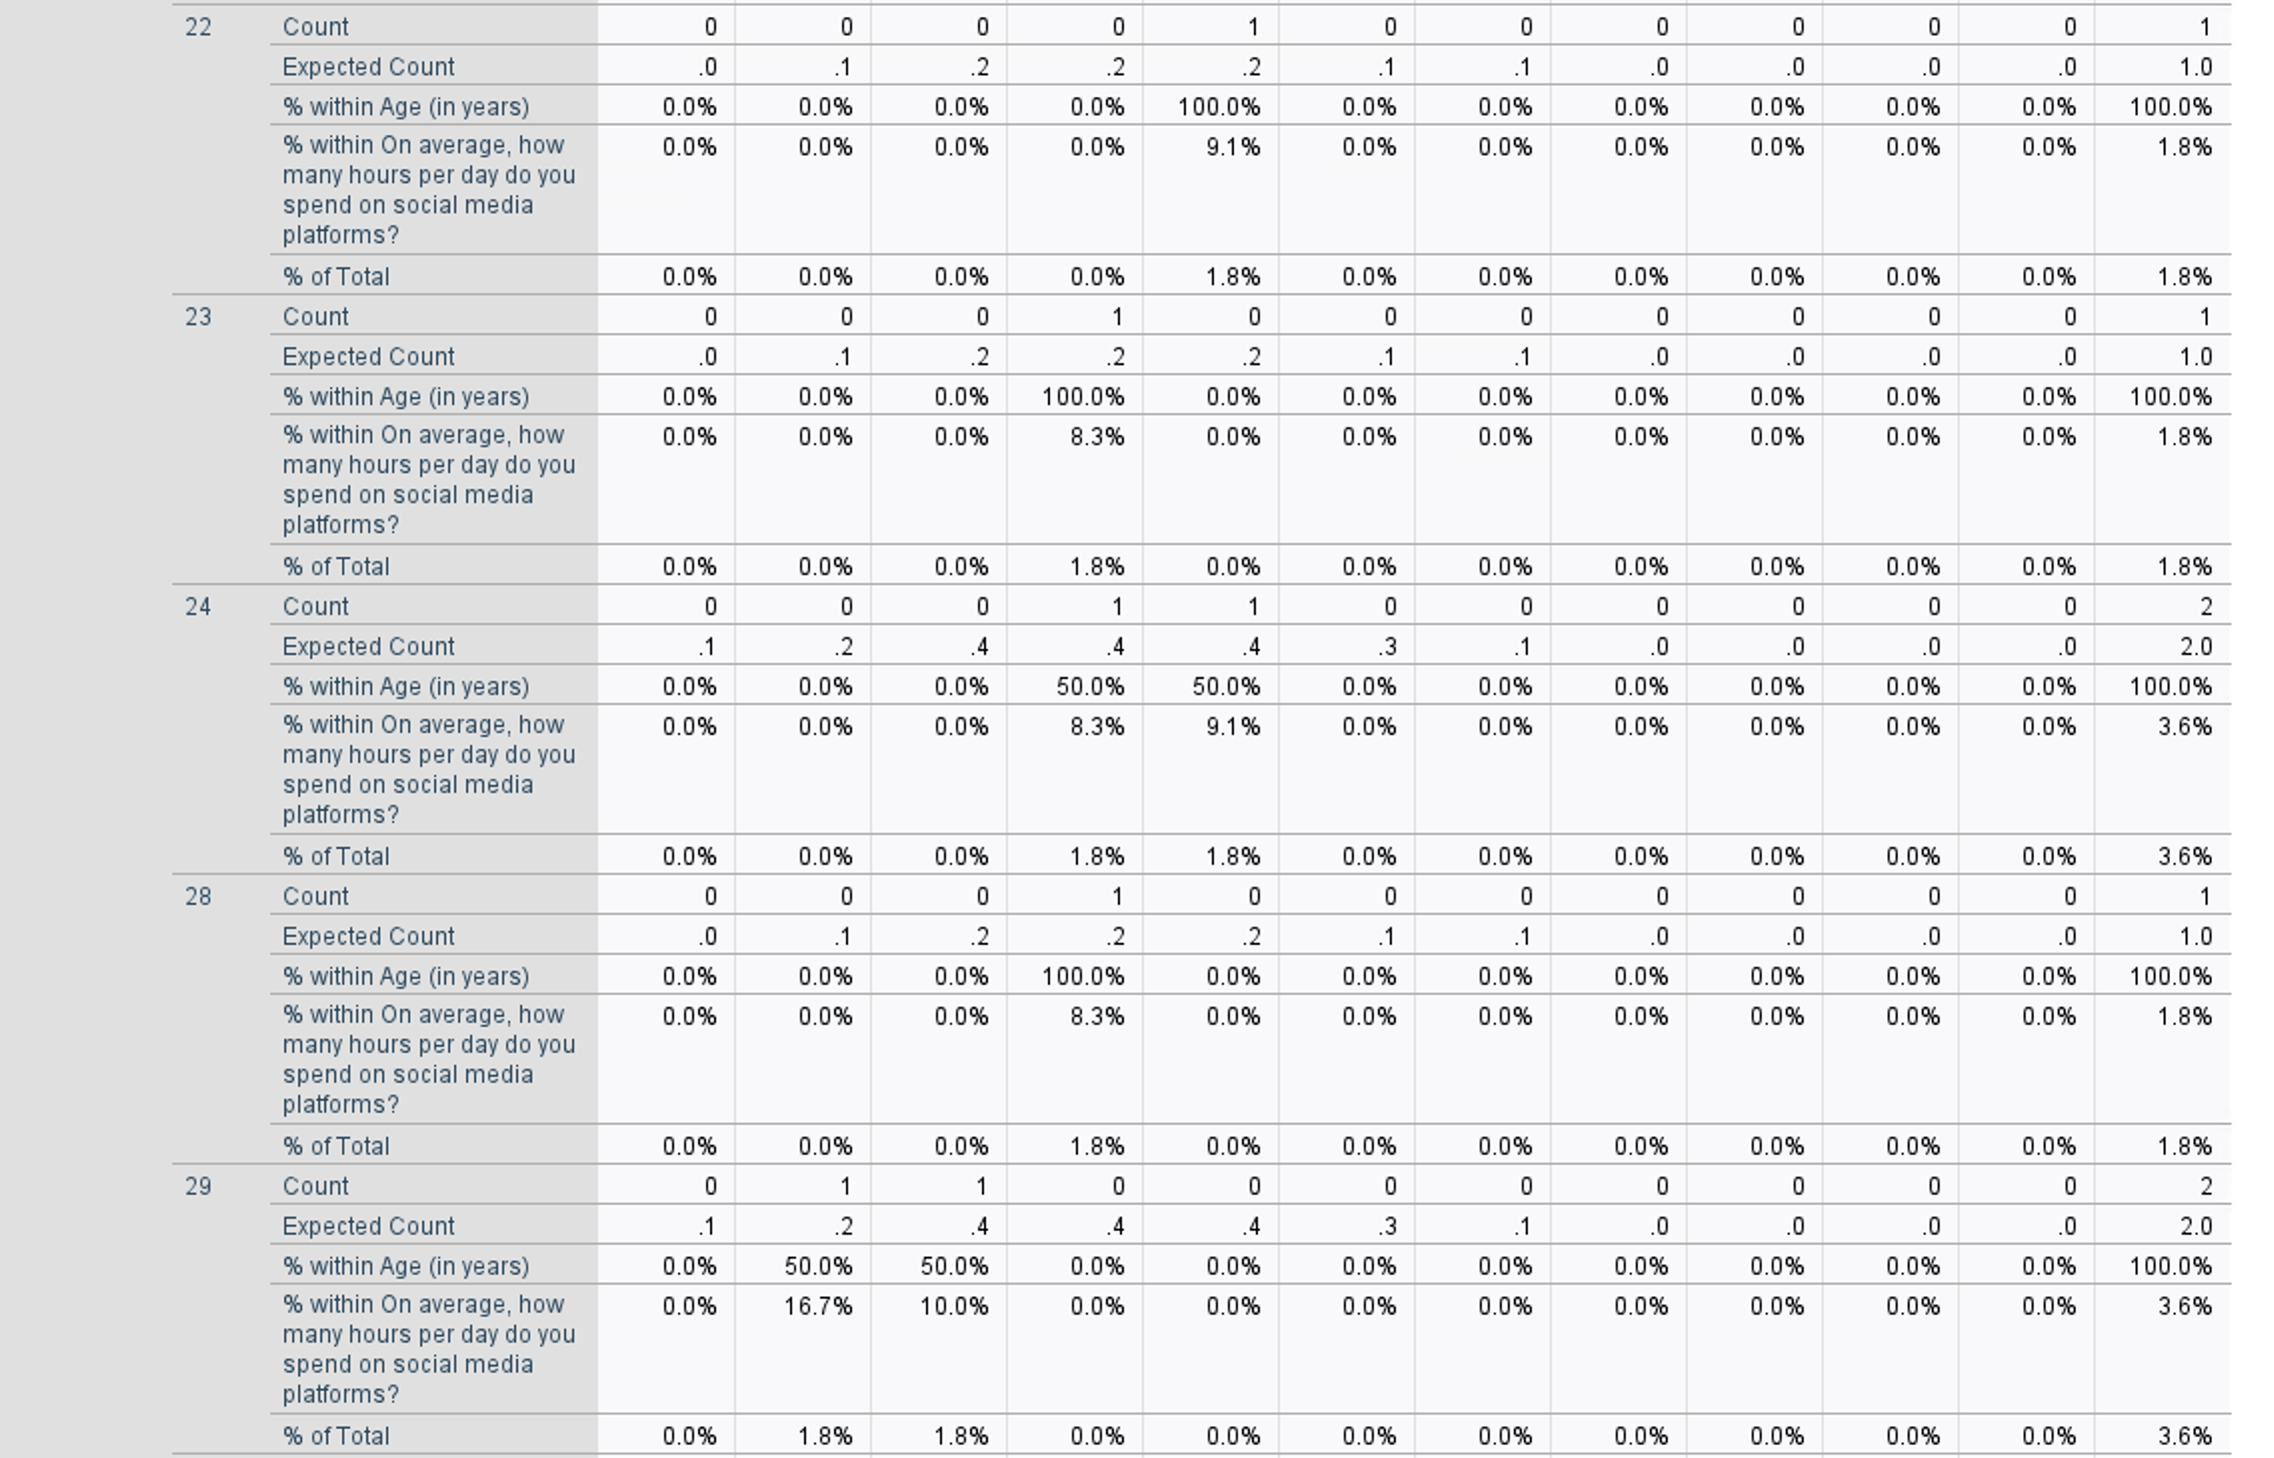
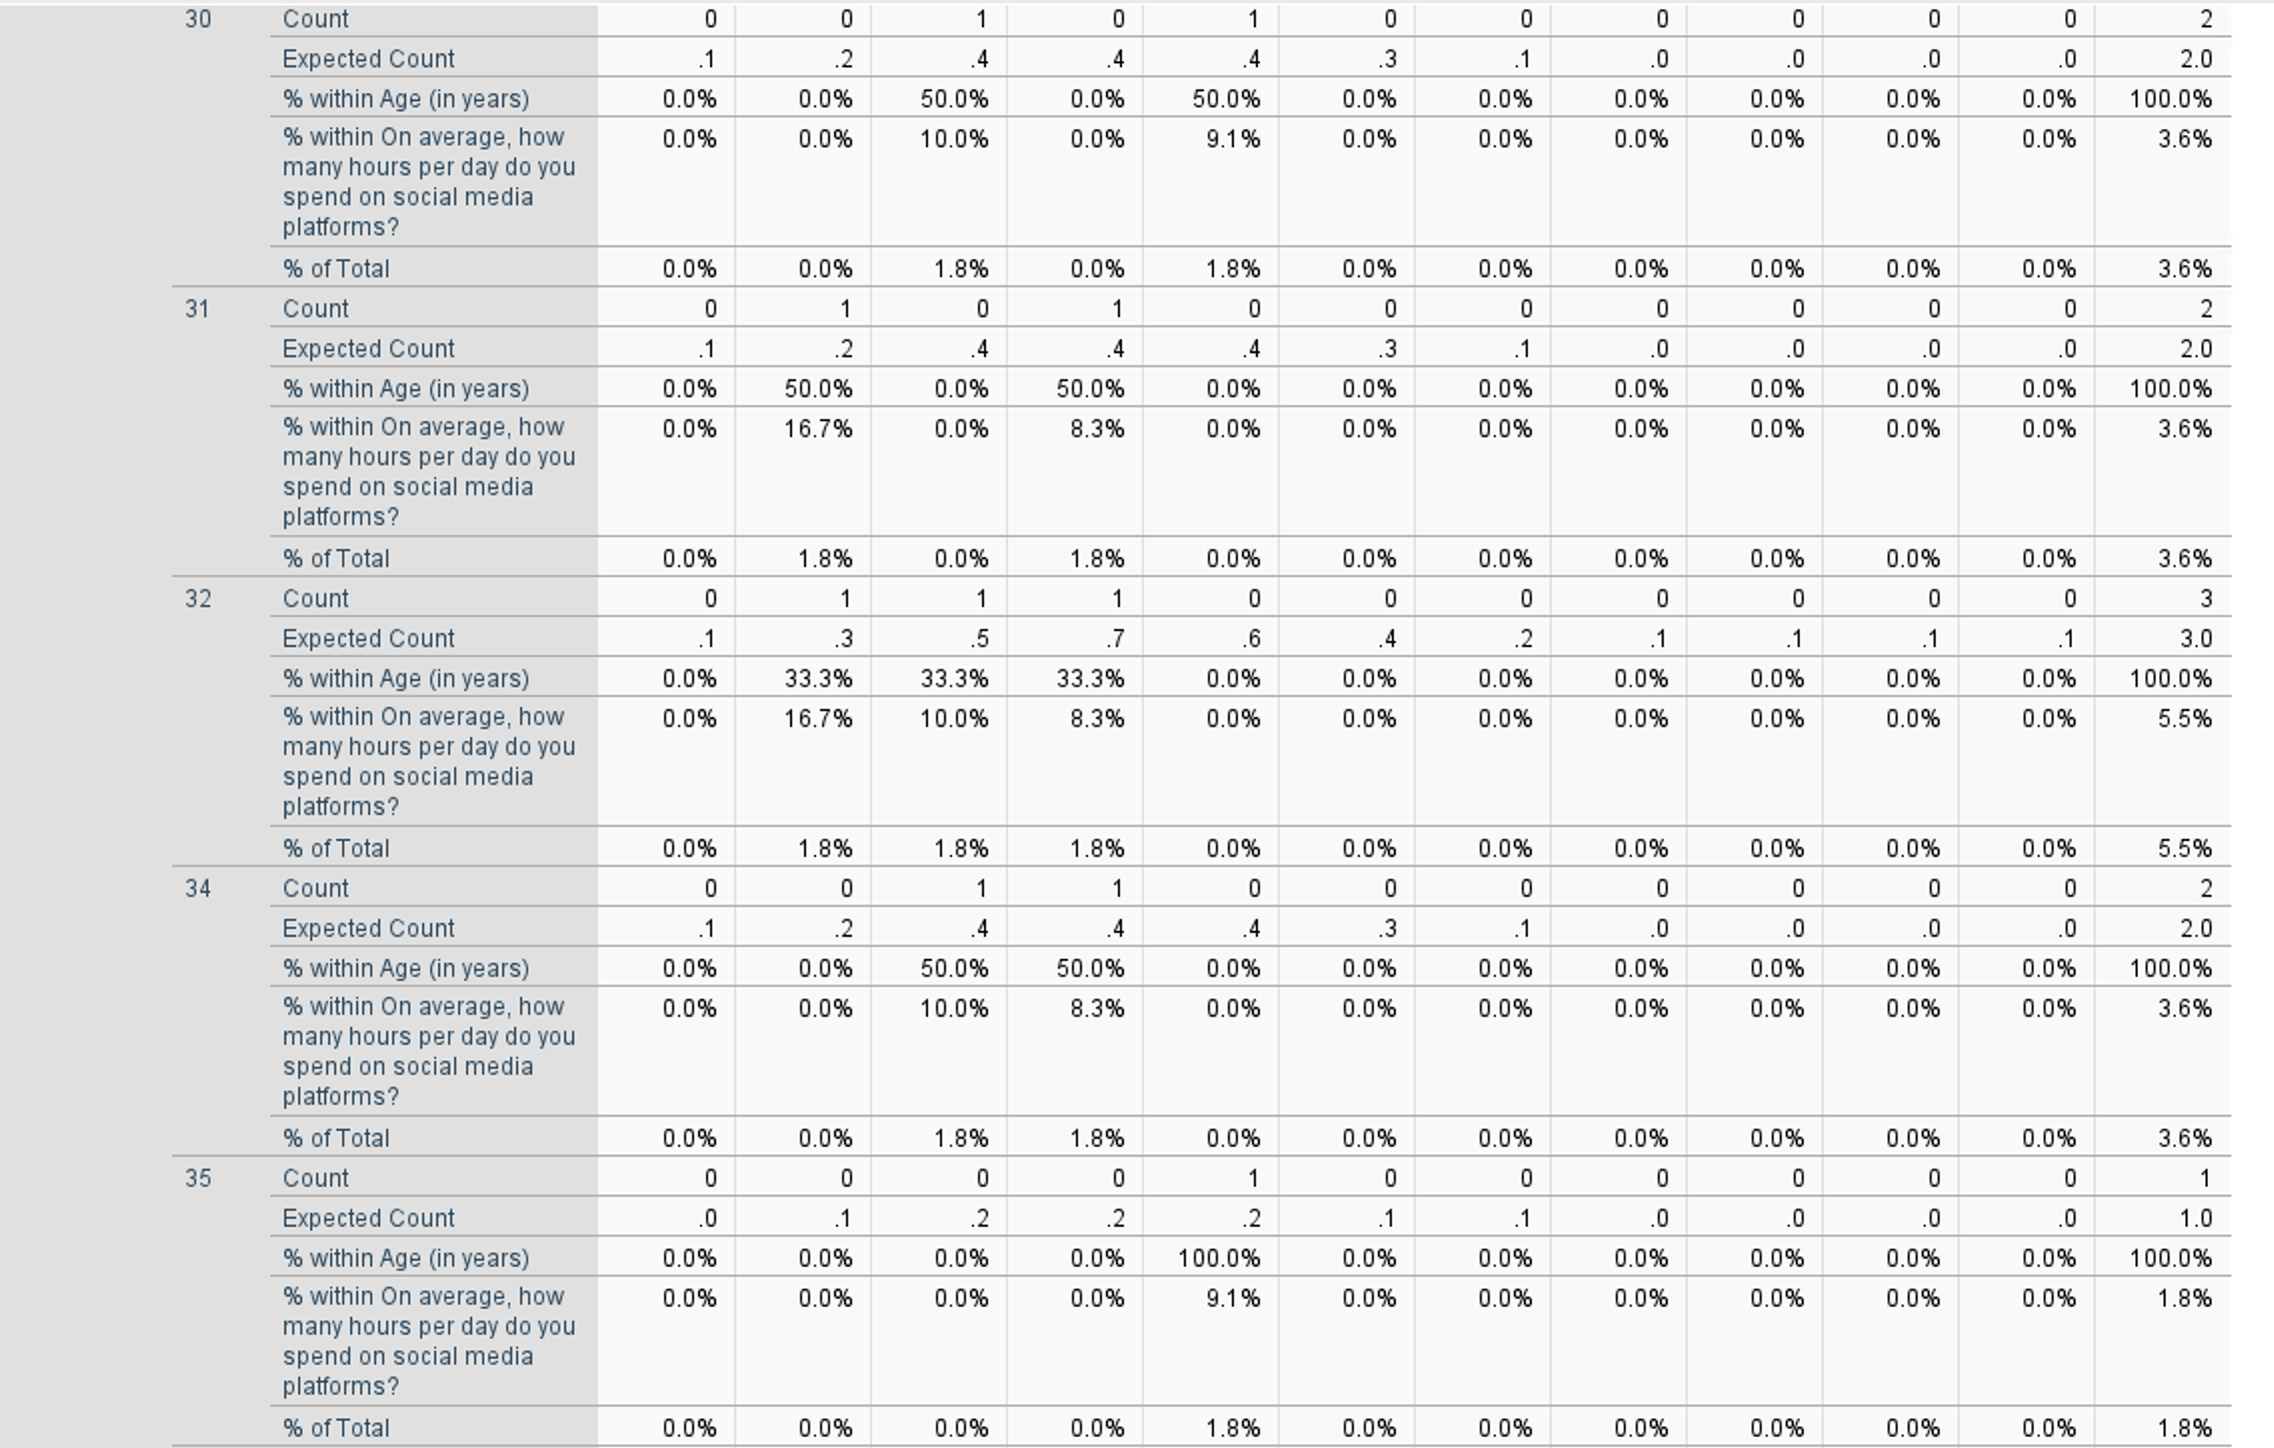
Crosstabs Case Processing Summary Cases Valid Missing Total N Percent N Percent N Percent Age (in years) * On 55 98.2% 1 1.8% 56 100.0% average, how many hours per day do you spend on social media platforms?Chi-Square Tests Asymptotic Significance Value df (2-sided) Pearson Chi-Square 163.534 170 625 Likelihood Ratio 101.895 170 1.000 Linear-by-Linear 10.184 001 Association N of Valid Cases 55 a. 198 cells (100.0%) have expected count less than 5. The minimum expected count is .02.Descriptives [DataSet1] C:\\Users\\anesia.joseph\\Downloads\\Mock study.sav Descriptive Statistics N Minimum Maximum Mean Std. Deviation Age (in years) 55 18 51 25.93 8.781 On average, how many 55 .5 12.0 3.564 2.1646 hours per day do you spend on social media platforms? Valid N (listwise) 55Age (in years) Age (in years) * On average, how many hours per day do you spend on social media platforms? Crosstabulation On average, how many hours per day do you spend on social media platforms? 5 1.0 2.0 30 4.0 5.0 6.0 7.0 8.0 9.0 12.0 Total 18 Count 0 0 0 0 1 0 0 0 0 1 0 2 Expected Count A 2 4 4 4 3 Bl 0 0 0 .0 2.0 % within Age (in years) 0.0% 0.0% 0.0% 0.0% 50.0% 0.0% 0.0% 0.0% 0.0% 50.0% 0.0% 100.0% % within On average, how 0.0% 0.0% 0.0% 0.0% 9.1% 0.0% 0.0% 0.0% 0.0% 100.0% 0.0% 3.6% many hours per day do you spend on social media platforms? % of Total 0.0% 0.0% 0.0% 0.0% 1.8% 0.0% 0.0% 0.0% 0.0% 1.8% 0.0% 3.6% 19 Count 0 1 0 4 3 3 3 1 0 0 1 16 Expected Count 6 1.7 2.9 35 32 2.0 9 & &) 3 3 16.0 % within Age (in years) 0.0% 6.3% 0.0% 25.0% 18.8% 18.8% 18.8% 6.3% 0.0% 0.0% 6.3% 100.0% % within On average, how 0.0% 16.7% 0.0% 33.3% 27.3% 42.9% 100.0% 100.0% 0.0% 0.0% 100.0% 29.1% many hours per day do you spend on social media platforms? % of Total 0.0% 1.8% 0.0% 7.3% 5.5% 55% 5.5% 1.8% 0.0% 0.0% 1.8% 29.1% 20 Count 0 0 1 2 1 2 0 0 0 0 0 6 Expected Count 2 ot 1.1 1.3 12 8 3 il Al 4l S 6.0 % within Age (in years) 0.0% 0.0% 16.7% 33.3% 16.7% 33.3% 0.0% 0.0% 0.0% 0.0% 0.0% 100.0% % within On average, how 0.0% 0.0% 10.0% 16.7% 9.1% 28.6% 0.0% 0.0% 0.0% 0.0% 0.0% 10.9% many hours per day do you spend on social media platforms? % of Total 0.0% 0.0% 1.8% 3.6% 1.8% 3.6% 0.0% 0.0% 0.0% 0.0% 0.0% 10.9% 21 Count 0 1 2 0 1 1 0 0 1 0 0 6 Expected Count 2 ol 15 153 152 8 9 3 3l 5l A 6.0 % within Age (in years) 0.0% 16.7% 33.3% 0.0% 16.7% 16.7% 0.0% 0.0% 16.7% 0.0% 0.0% 100.0% % within On average, how 0.0% 16.7% 20.0% 0.0% 9.1% 14.3% 0.0% 0.0% 100.0% 0.0% 0.0% 10.9% many hours per day do you spend on social media platforms? % of Total 0.0% 1.8% 3.6% 0.0% 1.8% 1.8% 0.0% 0.0% 1.8% 0.0% 0.0% 10.9% 37 Count 2 0 0 0 0 0 0 0 0 0 0 2 Expected Count o 12 4 4 4 3 Al 0 0 0 0 2.0 % within Age (in years) 100.0% 0.0% 0.0% 0.0% 0.0% 0.0% 0.0% 0.0% 0.0% 0.0% 0.0% 100.0% % within On average, how 100.0% 0.0% 0.0% 0.0% 0.0% 0.0% 0.0% 0.0% 0.0% 0.0% 0.0% 3.6% many hours per day do you spend on social media platforms? % of Total 3.6% 0.0% 0.0% 0.0% 0.0% 0.0% 0.0% 0.0% 0.0% 0.0% 0.0% 3.6% 39 Count 0 0 2 0 0 1 0 0 0 0 0 3 Expected Count A 3 5 2 6 4 22 A A al A 3.0 % within Age (in years) 0.0% 0.0% 66.7% 0.0% 0.0% 33.3% 0.0% 0.0% 0.0% 0.0% 0.0% 100.0% % within On average, how 0.0% 0.0% 20.0% 0.0% 0.0% 14.3% 0.0% 0.0% 0.0% 0.0% 0.0% 5.5% many hours per day do you spend on social media platforms? % of Total 0.0% 0.0% 3.6% 0.0% 0.0% 1.8% 0.0% 0.0% 0.0% 0.0% 0.0% 5.5% 49 Count 0 1 0 0 1 0 0 0 0 0 0 2 Expected Count 4l 2 4 4 4 3 A 0 0 .0 .0 2.0 % within Age (in years) 0.0% 50.0% 0.0% 0.0% 50.0% 0.0% 0.0% 0.0% 0.0% 0.0% 0.0% 100.0% % within On average, how 0.0% 16.7% 0.0% 0.0% 9.1% 0.0% 0.0% 0.0% 0.0% 0.0% 0.0% 3.6% many hours per day do you spend on social media platforms? % of Total 0.0% 1.8% 0.0% 0.0% 1.8% 0.0% 0.0% 0.0% 0.0% 0.0% 0.0% 3.6% 51 Count 0 0 1 0 0 0 0 0 0 0 0 1 Expected Count .0 A 2 2 2 i &) .0 .0 .0 .0 1.0 % within Age (in years) 0.0% 0.0% 100.0% 0.0% 0.0% 0.0% 0.0% 0.0% 0.0% 0.0% 0.0% 100.0% % within On average, how 0.0% 0.0% 10.0% 0.0% 0.0% 0.0% 0.0% 0.0% 0.0% 0.0% 0.0% 1.8% many hours per day do you spend on social media platforms? % of Total 0.0% 0.0% 1.8% 0.0% 0.0% 0.0% 0.0% 0.0% 0.0% 0.0% 0.0% 1.8% Total Count 2 6 10 12 11 7 3 1 1 1 1 55 Expected Count 2.0 6.0 10.0 12.0 11.0 7.0 3.0 1.0 1.0 1.0 1.0 55.0 % within Age (in years) 3.6% 10.9% 18.2% 21.8% 20.0% 12.7% 5.5% 1.8% 1.8% 1.8% 1.8% 100.0% % within On average, how 100.0% 100.0% 100.0% 100.0% 100.0% 100.0% 100.0% 100.0% 100.0% 100.0% 100.0% 100.0% many hours per day do you spend on social media platforms? % of Total 3.6% 10.9% 18.2% 21.8% 20.0% 12.7% 5.5% 1.8% 1.8% 1.8% 1.8% 100.0% 22 Count 0 0 0 0 1 0 0 0 0 0 0 1 Expected Count .0 al) 22 2 2 al) 3l .0 .0 .0 .0 1.0 % within Age (in years) 0.0% 0.0% 0.0% 0.0% 100.0% 0.0% 0.0% 0.0% 0.0% 0.0% 0.0% 100.0% % within On average, how 0.0% 0.0% 0.0% 0.0% 9.1% 0.0% 0.0% 0.0% 0.0% 0.0% 0.0% 1.8% many hours per day do you spend on social media platforms? % of Total 0.0% 0.0% 0.0% 0.0% 1.8% 0.0% 0.0% 0.0% 0.0% 0.0% 0.0% 1.8% 23 Count 0 0 0 1 0 0 0 0 0 0 0 1 Expected Count .0 H 2 2 2 o 4l .0 .0 .0 .0 1.0 % within Age (in years) 0.0% 0.0% 0.0% 100.0% 0.0% 0.0% 0.0% 0.0% 0.0% 0.0% 0.0% 100.0% % within On average, how 0.0% 0.0% 0.0% 8.3% 0.0% 0.0% 0.0% 0.0% 0.0% 0.0% 0.0% 1.8% many hours per day do you spend on social media platforms? % of Total 0.0% 0.0% 0.0% 1.8% 0.0% 0.0% 0.0% 0.0% 0.0% 0.0% 0.0% 1.8% 24 Count 0 0 0 1 1 0 0 0 0 0 0 2 Expected Count o 2 4 4 4 .3 A .0 .0 .0 .0 2.0 % within Age (in years) 0.0% 0.0% 0.0% 50.0% 50.0% 0.0% 0.0% 0.0% 0.0% 0.0% 0.0% 100.0% % within On average, how 0.0% 0.0% 0.0% 8.3% 9.1% 0.0% 0.0% 0.0% 0.0% 0.0% 0.0% 3.6% many hours per day do you spend on social media platforms? % of Total 0.0% 0.0% 0.0% 1.8% 1.8% 0.0% 0.0% 0.0% 0.0% 0.0% 0.0% 3.6% 28 Count 0 0 0 1 0 0 0 0 0 0 0 1 Expected Count .0 o 2 2 2 4 i .0 .0 .0 .0 1.0 % within Age (in years) 0.0% 0.0% 0.0% 100.0% 0.0% 0.0% 0.0% 0.0% 0.0% 0.0% 0.0% 100.0% % within On average, how 0.0% 0.0% 0.0% 8.3% 0.0% 0.0% 0.0% 0.0% 0.0% 0.0% 0.0% 1.8% many hours per day do you spend on social media platforms? % of Total 0.0% 0.0% 0.0% 1.8% 0.0% 0.0% 0.0% 0.0% 0.0% 0.0% 0.0% 1.8% 29 Count 0 1 1 0 0 0 0 0 0 0 0 2 Expected Count A 2 4 4 4 =) A .0 .0 .0 .0 2.0 % within Age (in years) 0.0% 50.0% 50.0% 0.0% 0.0% 0.0% 0.0% 0.0% 0.0% 0.0% 0.0% 100.0% % within On average, how 0.0% 16.7% 10.0% 0.0% 0.0% 0.0% 0.0% 0.0% 0.0% 0.0% 0.0% 3.6% many hours per day do you spend on social media platforms? % of Total 0.0% 1.8% 1.8% 0.0% 0.0% 0.0% 0.0% 0.0% 0.0% 0.0% 0.0% 3.6% 30 Count 0 0 1 0 1 0 0 0 0 0 0 2 Expected Count 1 .2 4 3 0 0 .0 0 2.0 % within Age (in years) 0.0% 0.0% 50.0% 0.0% 50.0% 0.0% 0.0% 0.0% 0.0% 0.0% 0.0% 100.0% % within On average, how 0.0% 0.0% 10.0% 0.0% 9.1% 0.0% 0.0% 0.0% 0.0% 0.0% 0.0% 3.6% many hours per day do you spend on social media platforms? % of Total 0.0% 0.0% 1.8% 0.0% 1.8% 0.0% 0.0% 0.0% 0.0% 0.0% 0.0% 3.6% 31 Count 0 0 0 0 0 0 0 2 Expected Count .2 .4 4 3 .0 .0 2.0 % within Age (in years) 0.0% 50.0% 0.0% 50.0% 0.0% 0.0% 0.0% 0.0% 0.0% 0.0% 0.0% 100.0% % within On average, how 0.0% 16.7% 0.0% 8.3% 0.0% 0.0% 0.0% 0.0% 0.0% 0.0% 0.0% 3.6% many hours per day do you spend on social media platforms? % of Total 0.0% 1.8% 0.0% 1.8% 0.0% 0.0% 0.0% 0.0% 0.0% 0.0% 0.0% 3.6% 32 Count 0 0 0 0 3 Expected Count .3 .5 .7 6 2 3.0 % within Age (in years) 0.0% 33.3% 33.3% 33.3% 0.0% 0.0% 0.0% 0.0% 0.0% 0.0% 0.0% 100.0% % within On average, how 0.0% 16.7% 10.0% 8.3% 0.0% 0.0% 0.0% 0.0% 0.0% 0.0% 0.0% 5.5% many hours per day do you spend on social media platforms? % of Total 0.0% 1.8% 1.8% 1.8% 0.0% 0.0% 0.0% 0.0% 0.0% 0.0% 0.0% 5.5% 34 Count 0 0 0 0 2 Expected Count 1 .2 . 4 4 .3 1 .0 0 2.0 % within Age (in years) 0.0% 0.0% 50.0% 50.0% 0.0% 0.0% 0.0% 0.0% 0.0% 0.0% 0.0% 100.0% % within On average, how 0.0% 0.0% 10.0% 8.3% 0.0% 0.0% 0.0% 0.0% 0.0% 0.0% 0.0% 3.6% many hours per day do you spend on social media platforms? % of Total 0.0% 0.0% 1.8% 1.8% 0.0% 0.0% 0.0% 0.0% 0.0% 0.0% 0.0% 3.6% 35 Count 0 Expected Count .0 1 2 2 .2 1 .0 0 .0 1.0 % within Age (in years) 0.0% 0.0% 0.0% 0.0% 100.0% 0.0% 0.0% 0.0% 0.0% 0.0% 0.0% 100.0% % within On average, how 0.0% 0.0% 0.0% 0.0% 9.1% 0.0% 0.0% 0.0% 0.0% 0.0% 0.0% 1.8% many hours per day do you spend on social media platforms? % of Total 0.0% 0.0% 0.0% 0.0% 1.8% 0.0% 0.0% 0.0% 0.0% 0.0% 0.0% 1.8%
Step by Step Solution
There are 3 Steps involved in it

Get step-by-step solutions from verified subject matter experts