

Question: Choose a random FTSE100 stock for the exercise. Excel as reference: Assume that the risk-free interest rate is 2.5% per year. Set up an Option
Choose a random FTSE100 stock for the exercise.
Excel as reference:
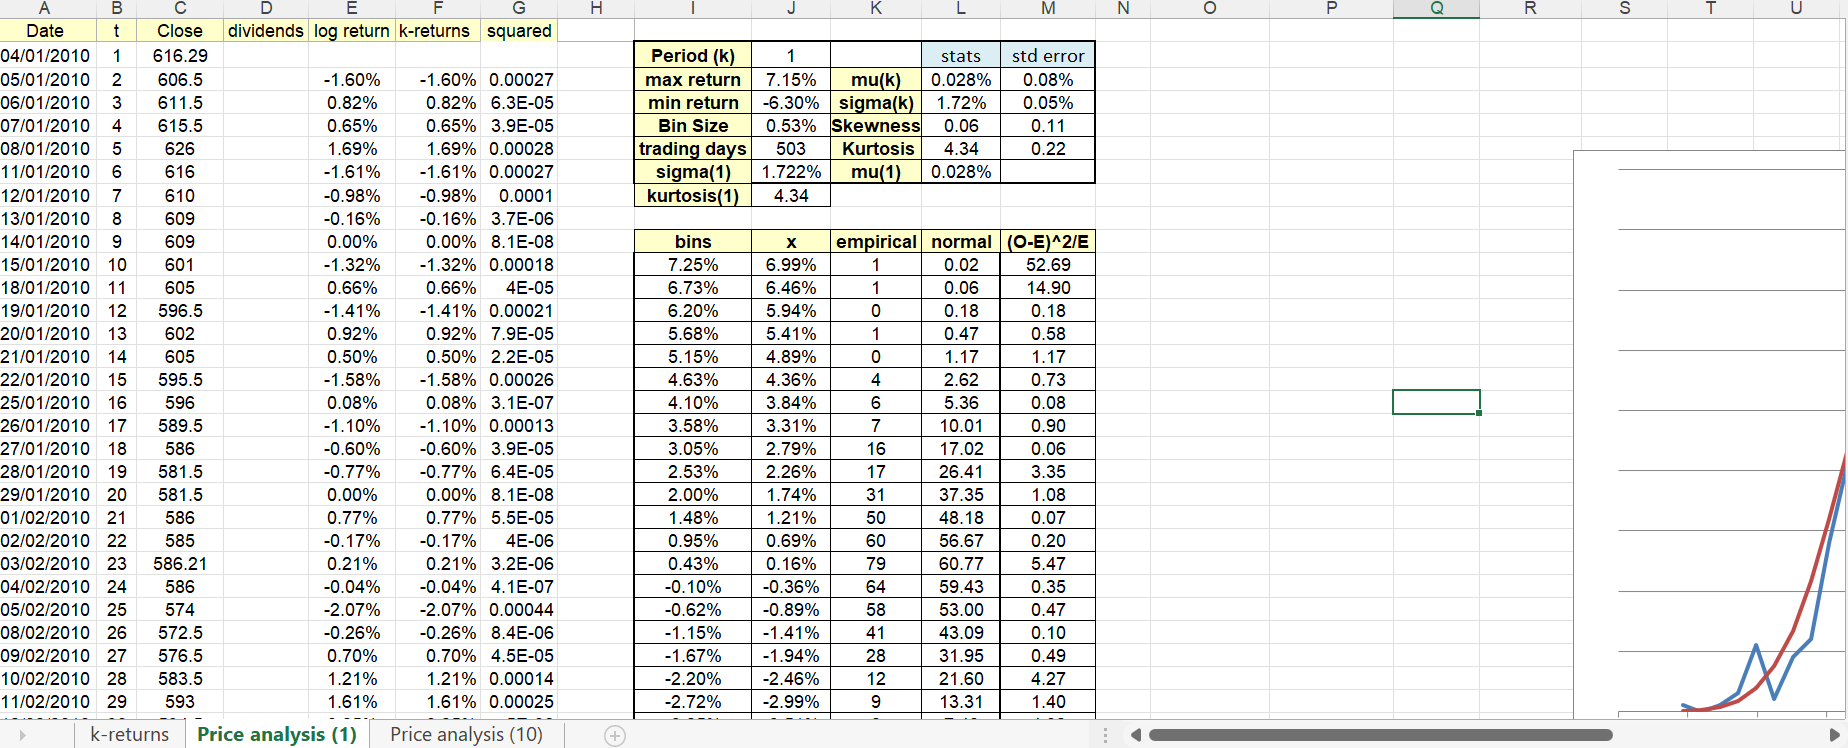
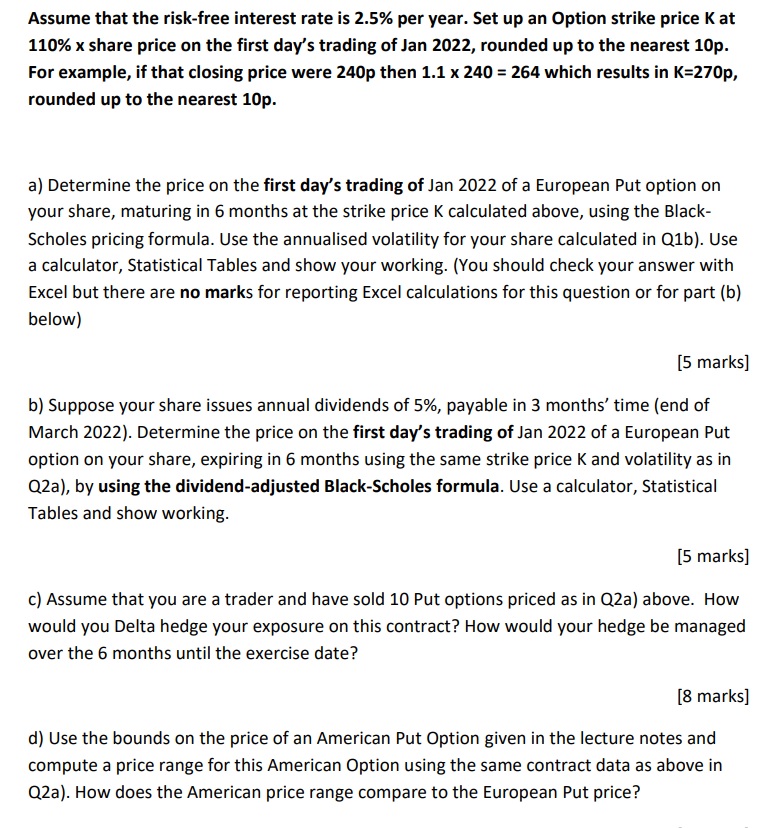
Assume that the risk-free interest rate is 2.5% per year. Set up an Option strike price Kat 110% x share price on the first day's trading of Jan 2022, rounded up to the nearest 10p. For example, if that closing price were 240p then 1.1 x 240 = 264 which results in K=270p, rounded up to the nearest 10p. a) Determine the price on the first day's trading of Jan 2022 of a European Put option on your share, maturing in 6 months at the strike price K calculated above, using the Black- Scholes pricing formula. Use the annualised volatility for your share calculated in Q1b). Use a calculator, Statistical Tables and show your working. (You should check your answer with Excel but there are no marks for reporting Excel calculations for this question or for part (b) below) (5 marks] b) Suppose your share issues annual dividends of 5%, payable in 3 months' time (end of March 2022). Determine the price on the first day's trading of Jan 2022 of a European Put option on your share, expiring in 6 months using the same strike price K and volatility as in Q2a), by using the dividend-adjusted Black-Scholes formula. Use a calculator, Statistical Tables and show working. [5 marks) c) Assume that you are a trader and have sold 10 Put options priced as in Q2a) above. How would you Delta hedge your exposure on this contract? How would your hedge be managed over the 6 months until the exercise date? [8 marks] d) Use the bounds on the price of an American Put Option given in the lecture notes and compute a price range for this American Option using the same contract data as above in Q2a). How does the American price range compare to the European Put price? H J K L M N o R S T U Period (k) max return min return Bin Size trading days sigma(1) kurtosis(1) 1 stats 7.15% mu(k) 0.028% -6.30% sigma(k) 1.72% 0.53% Skewness 0.06 503 Kurtosis 4.34 1.722% mu(1) 0.028% 4.34 std error 0.08% 0.05% 0.11 0.22 A B E F G Date t Close dividends log return k-returns squared 04/01/2010 1 616.29 05/01/2010 2 606.5 -1.60% -1.60% 0.00027 06/01/2010 3 611.5 0.82% 0.82% 6.3E-05 07/01/2010 4 615.5 0.65% 0.65% 3.9E-05 08/01/2010 5 626 1.69% 1.69% 0.00028 11/01/2010 6 616 -1.61% -1.61% 0.00027 12/01/2010 7 610 -0.98% -0.98% 0.0001 13/01/2010 8 609 -0.16% -0.16% 3.7E-06 14/01/2010 9 609 0.00% 0.00% 8.1E-08 15/01/2010 10 601 -1.32% -1.32% 0.00018 18/01/2010 11 605 0.66% 0.66% 4E-05 19/01/2010 12 596.5 -1.41% -1.41% 0.00021 20/01/2010 13 602 0.92% 0.92% 7.9E-05 21/01/2010 14 605 0.50% 0.50% 2.2E-05 22/01/2010 15 595.5 -1.58% -1.58% 0.00026 25/01/2010 16 596 0.08% 0.08% 3.1E-07 26/01/2010 17 589.5 -1.10% -1.10% 0.00013 27/01/2010 18 586 -0.60% -0.60% 3.9E-05 28/01/2010 19 581.5 -0.77% -0.77% 6.4E-05 29/01/2010 20 581.5 0.00% 0.00% 8.1E-08 01/02/2010 21 586 0.77% 0.77% 5.5E-05 02/02/2010 22 585 -0.17% -0.17% 4E-06 03/02/2010 23 586.21 0.21% 0.21% 3.2E-06 04/02/2010 24 586 -0.04% -0.04% 4.1E-07 05/02/2010 25 574 -2.07% -2.07% 0.00044 08/02/2010 26 572.5 -0.26% -0.26% 8.4E-06 09/02/2010 27 576.5 0.70% 0.70% 4.5E-05 10/02/2010 28 583.5 1.21% 1.21% 0.00014 11/02/2010 29 593 1.61% 1.61% 0.00025 k-returns Price analysis (1) Price analysis (10) bins 7.25% 6.73% 6.20% 5.68% 5.15% 4.63% 4.10% 3.58% 3.05% 2.53% 2.00% 1.48% 0.95% 0.43% -0.10% -0.62% -1.15% -1.67% -2.20% -2.72% 6.99% 6.46% 5.94% 5.41% 4.89% 4.36% 3.84% 3.31% 2.79% 2.26% 1.74% 1.21% 0.69% 0.16% -0.36% -0.89% -1.41% -1.94% -2.46% -2.99% empirical normal (O-E)^2/E 1 0.02 52.69 1 0.06 14.90 0 0 0.18 0.18 1 0.47 0.58 0 1.17 1.17 4 2.62 0.73 6 5.36 0.08 7 10.01 0.90 16 17.02 0.06 17 26.41 3.35 31 37.35 1.08 50 48.18 0.07 60 56.67 0.20 79 60.77 5.47 64 59.43 0.35 58 53.00 0.47 41 43.09 0.10 28 31.95 0.49 12 21.60 4.27 9 13.31 1.40 ONICA Rideau Assume that the risk-free interest rate is 2.5% per year. Set up an Option strike price Kat 110% x share price on the first day's trading of Jan 2022, rounded up to the nearest 10p. For example, if that closing price were 240p then 1.1 x 240 = 264 which results in K=270p, rounded up to the nearest 10p. a) Determine the price on the first day's trading of Jan 2022 of a European Put option on your share, maturing in 6 months at the strike price K calculated above, using the Black- Scholes pricing formula. Use the annualised volatility for your share calculated in Q1b). Use a calculator, Statistical Tables and show your working. (You should check your answer with Excel but there are no marks for reporting Excel calculations for this question or for part (b) below) (5 marks] b) Suppose your share issues annual dividends of 5%, payable in 3 months' time (end of March 2022). Determine the price on the first day's trading of Jan 2022 of a European Put option on your share, expiring in 6 months using the same strike price K and volatility as in Q2a), by using the dividend-adjusted Black-Scholes formula. Use a calculator, Statistical Tables and show working. [5 marks) c) Assume that you are a trader and have sold 10 Put options priced as in Q2a) above. How would you Delta hedge your exposure on this contract? How would your hedge be managed over the 6 months until the exercise date? [8 marks] d) Use the bounds on the price of an American Put Option given in the lecture notes and compute a price range for this American Option using the same contract data as above in Q2a). How does the American price range compare to the European Put price? H J K L M N o R S T U Period (k) max return min return Bin Size trading days sigma(1) kurtosis(1) 1 stats 7.15% mu(k) 0.028% -6.30% sigma(k) 1.72% 0.53% Skewness 0.06 503 Kurtosis 4.34 1.722% mu(1) 0.028% 4.34 std error 0.08% 0.05% 0.11 0.22 A B E F G Date t Close dividends log return k-returns squared 04/01/2010 1 616.29 05/01/2010 2 606.5 -1.60% -1.60% 0.00027 06/01/2010 3 611.5 0.82% 0.82% 6.3E-05 07/01/2010 4 615.5 0.65% 0.65% 3.9E-05 08/01/2010 5 626 1.69% 1.69% 0.00028 11/01/2010 6 616 -1.61% -1.61% 0.00027 12/01/2010 7 610 -0.98% -0.98% 0.0001 13/01/2010 8 609 -0.16% -0.16% 3.7E-06 14/01/2010 9 609 0.00% 0.00% 8.1E-08 15/01/2010 10 601 -1.32% -1.32% 0.00018 18/01/2010 11 605 0.66% 0.66% 4E-05 19/01/2010 12 596.5 -1.41% -1.41% 0.00021 20/01/2010 13 602 0.92% 0.92% 7.9E-05 21/01/2010 14 605 0.50% 0.50% 2.2E-05 22/01/2010 15 595.5 -1.58% -1.58% 0.00026 25/01/2010 16 596 0.08% 0.08% 3.1E-07 26/01/2010 17 589.5 -1.10% -1.10% 0.00013 27/01/2010 18 586 -0.60% -0.60% 3.9E-05 28/01/2010 19 581.5 -0.77% -0.77% 6.4E-05 29/01/2010 20 581.5 0.00% 0.00% 8.1E-08 01/02/2010 21 586 0.77% 0.77% 5.5E-05 02/02/2010 22 585 -0.17% -0.17% 4E-06 03/02/2010 23 586.21 0.21% 0.21% 3.2E-06 04/02/2010 24 586 -0.04% -0.04% 4.1E-07 05/02/2010 25 574 -2.07% -2.07% 0.00044 08/02/2010 26 572.5 -0.26% -0.26% 8.4E-06 09/02/2010 27 576.5 0.70% 0.70% 4.5E-05 10/02/2010 28 583.5 1.21% 1.21% 0.00014 11/02/2010 29 593 1.61% 1.61% 0.00025 k-returns Price analysis (1) Price analysis (10) bins 7.25% 6.73% 6.20% 5.68% 5.15% 4.63% 4.10% 3.58% 3.05% 2.53% 2.00% 1.48% 0.95% 0.43% -0.10% -0.62% -1.15% -1.67% -2.20% -2.72% 6.99% 6.46% 5.94% 5.41% 4.89% 4.36% 3.84% 3.31% 2.79% 2.26% 1.74% 1.21% 0.69% 0.16% -0.36% -0.89% -1.41% -1.94% -2.46% -2.99% empirical normal (O-E)^2/E 1 0.02 52.69 1 0.06 14.90 0 0 0.18 0.18 1 0.47 0.58 0 1.17 1.17 4 2.62 0.73 6 5.36 0.08 7 10.01 0.90 16 17.02 0.06 17 26.41 3.35 31 37.35 1.08 50 48.18 0.07 60 56.67 0.20 79 60.77 5.47 64 59.43 0.35 58 53.00 0.47 41 43.09 0.10 28 31.95 0.49 12 21.60 4.27 9 13.31 1.40 ONICA Rideau
Step by Step Solution
There are 3 Steps involved in it

Get step-by-step solutions from verified subject matter experts