

Question: Choose correct graph /06/22 3:50 PM E Homework: Section 6.1 Question 7, 6.1.38-T HW Score: 60%, 6 of 10 points Homework Part 1 of 2
Choose correct graph
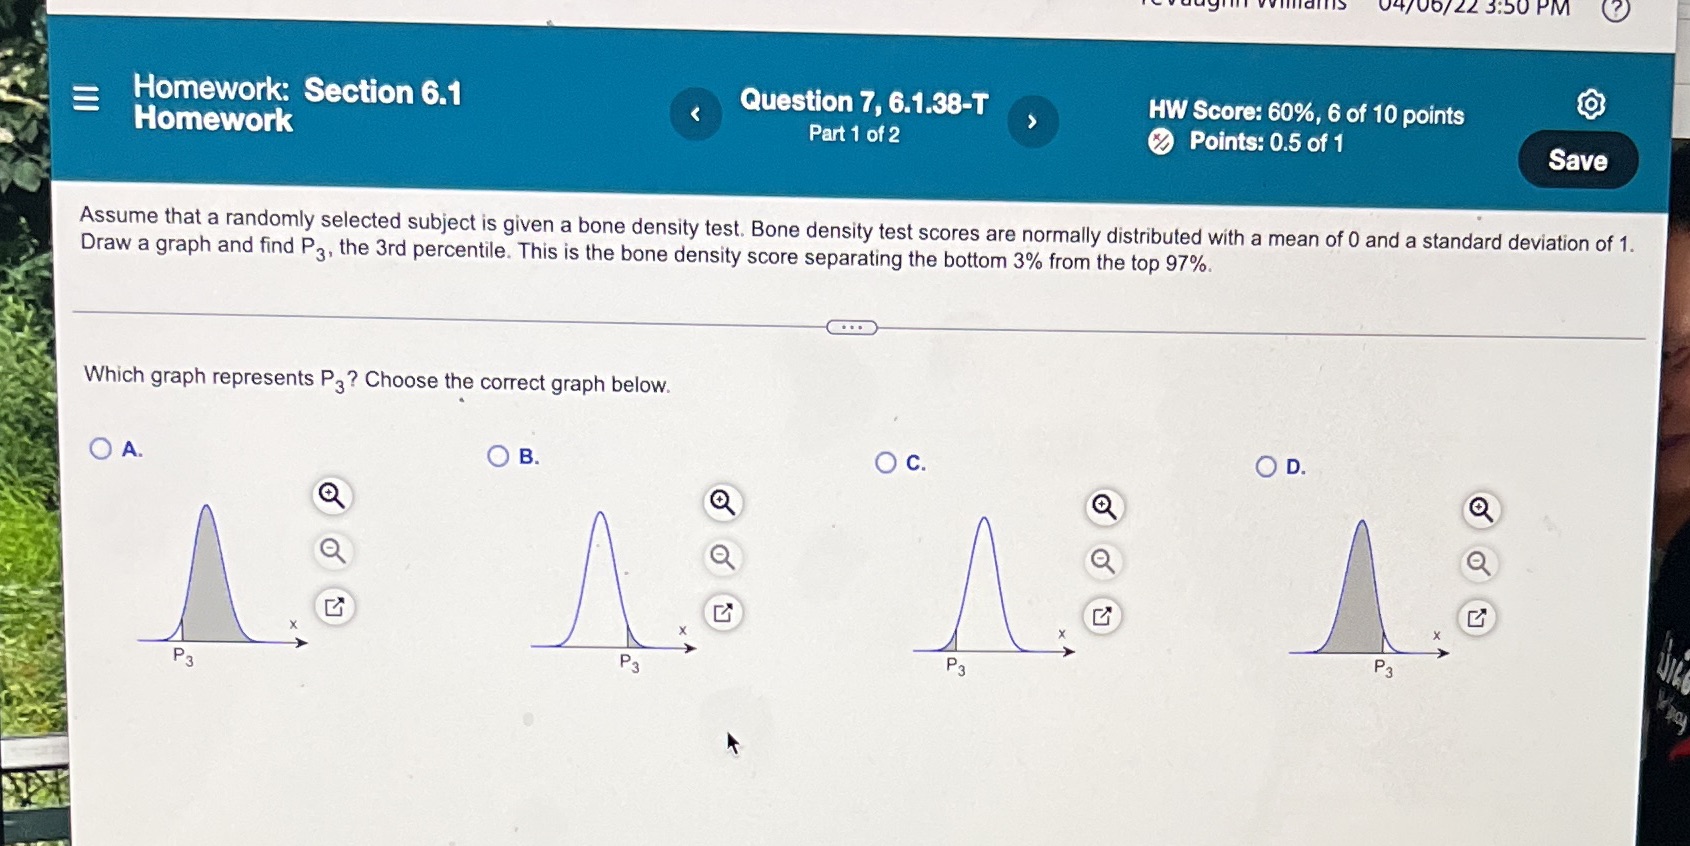
/06/22 3:50 PM E Homework: Section 6.1 Question 7, 6.1.38-T HW Score: 60%, 6 of 10 points Homework Part 1 of 2 Points: 0.5 of 1 Save Assume that a randomly selected subject is given a bone density test. Bone density test scores are normally distributed with a mean of 0 and a standard deviation of 1. Draw a graph and find P3, the 3rd percentile. This is the bone density score separating the bottom 3% from the top 97%. Which graph represents P3? Choose the correct graph below. O A. O B. O c. O D. O X X P3 P3 P3 P3
Step by Step Solution
There are 3 Steps involved in it
1 Expert Approved Answer
Step: 1 Unlock

Question Has Been Solved by an Expert!
Get step-by-step solutions from verified subject matter experts
Step: 2 Unlock
Step: 3 Unlock