

Question: Choose either: the x, y data set / the u, v data set / the w, t data set / the m, n data set
Choose either: the x, y data set / the u, v data set / the w, t data set / the m, n data set / or none of the data sets for each figure attached
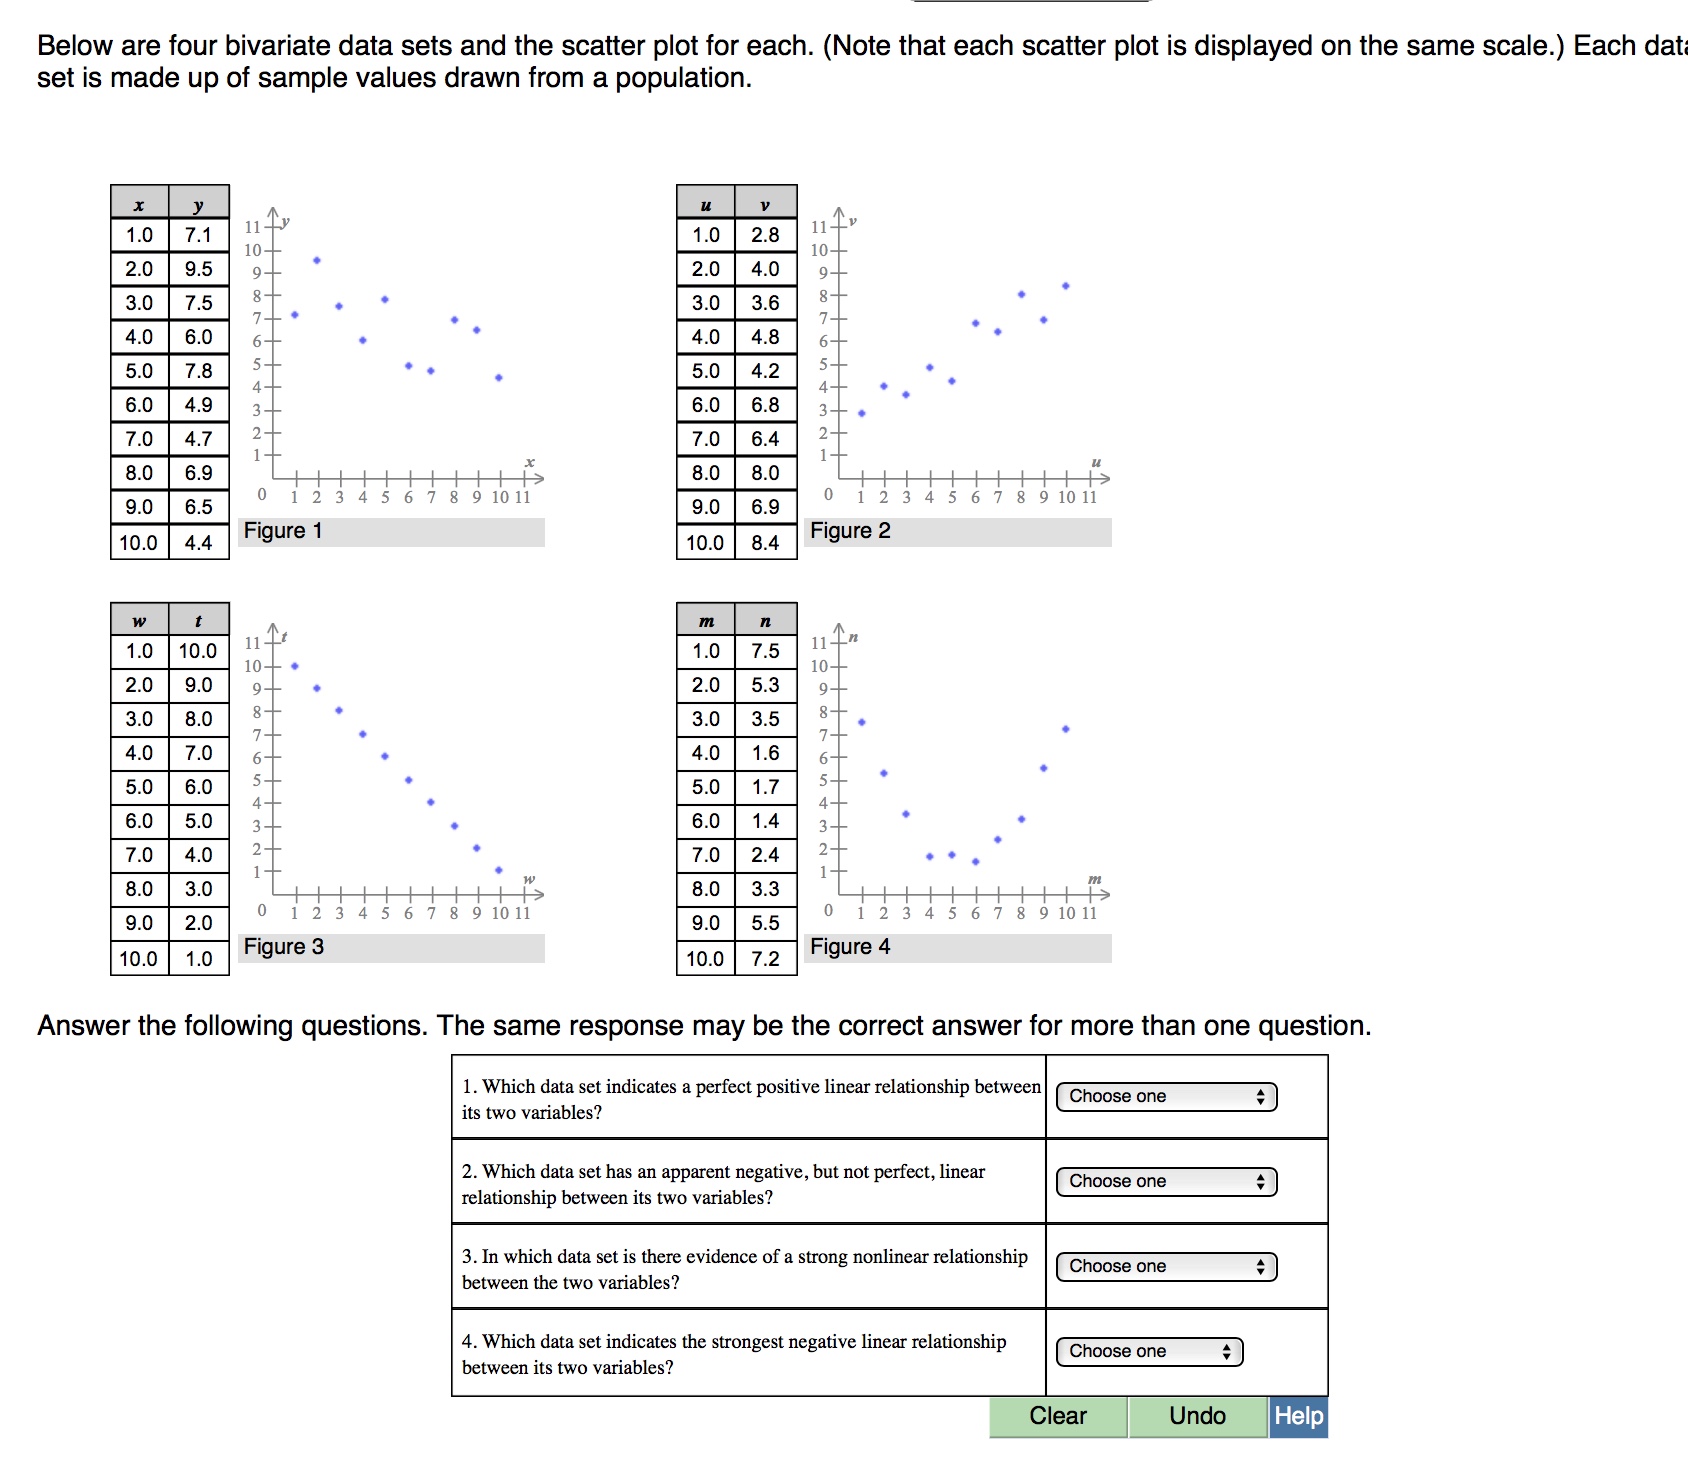
Below are four bivariate data sets and the scatter plot for each. (Note that each scatter plot is displayed on the same scale.) Each data set is made up of sample values drawn from a population. A ll lly 1 0 l] 10 . ' 10 9__ 2.0 9 3" . 3.0 3 7 ' o . 7 5 c 4.0 5 3 - . 5.0 i 3_ 6.0 3 2 7.0 2 lnlllilllllllxe 3-0 1 01234567891011 90 01234567891011 Figure 2 -m Figure 1 1&0 A m 11' 1 0 11 10 - ' 10 9__ , 2.0 9 '3" ' 3.0 3 7- o 7 6- . 4.0 5 5 - 51] 5 4 - 4 3 a 6.0 3 2 ' 7.0 2 1 . w 80 1 lllilllllll+ - 01234567891011 90 01234567891011 Figure 3 1o 0 Figure 4 Answer the iollowing questions. The same response may be the correct answer for more than one question. 1. Which data set indicates a perfect positive linear reiationship between its two variables? ' 2. Which data set has an apparent negative, but not perfect, linear v relationship between its two variables? 3. In which data set is there evidence of a strong nonlinear relationship _hoose _ne between the two variables? 4. Which data set indicates the strongest negative linear lelationship between its two variables? _hoose ne
Step by Step Solution
There are 3 Steps involved in it

Get step-by-step solutions from verified subject matter experts