

Question: Choose the Appropriate Multivariate Analysis Method & compare the collected evidence to the control data in regards to the glass fragments in table #2 Table
Choose the Appropriate Multivariate Analysis Method & compare the collected evidence to the control data in regards to the glass fragments in table #2
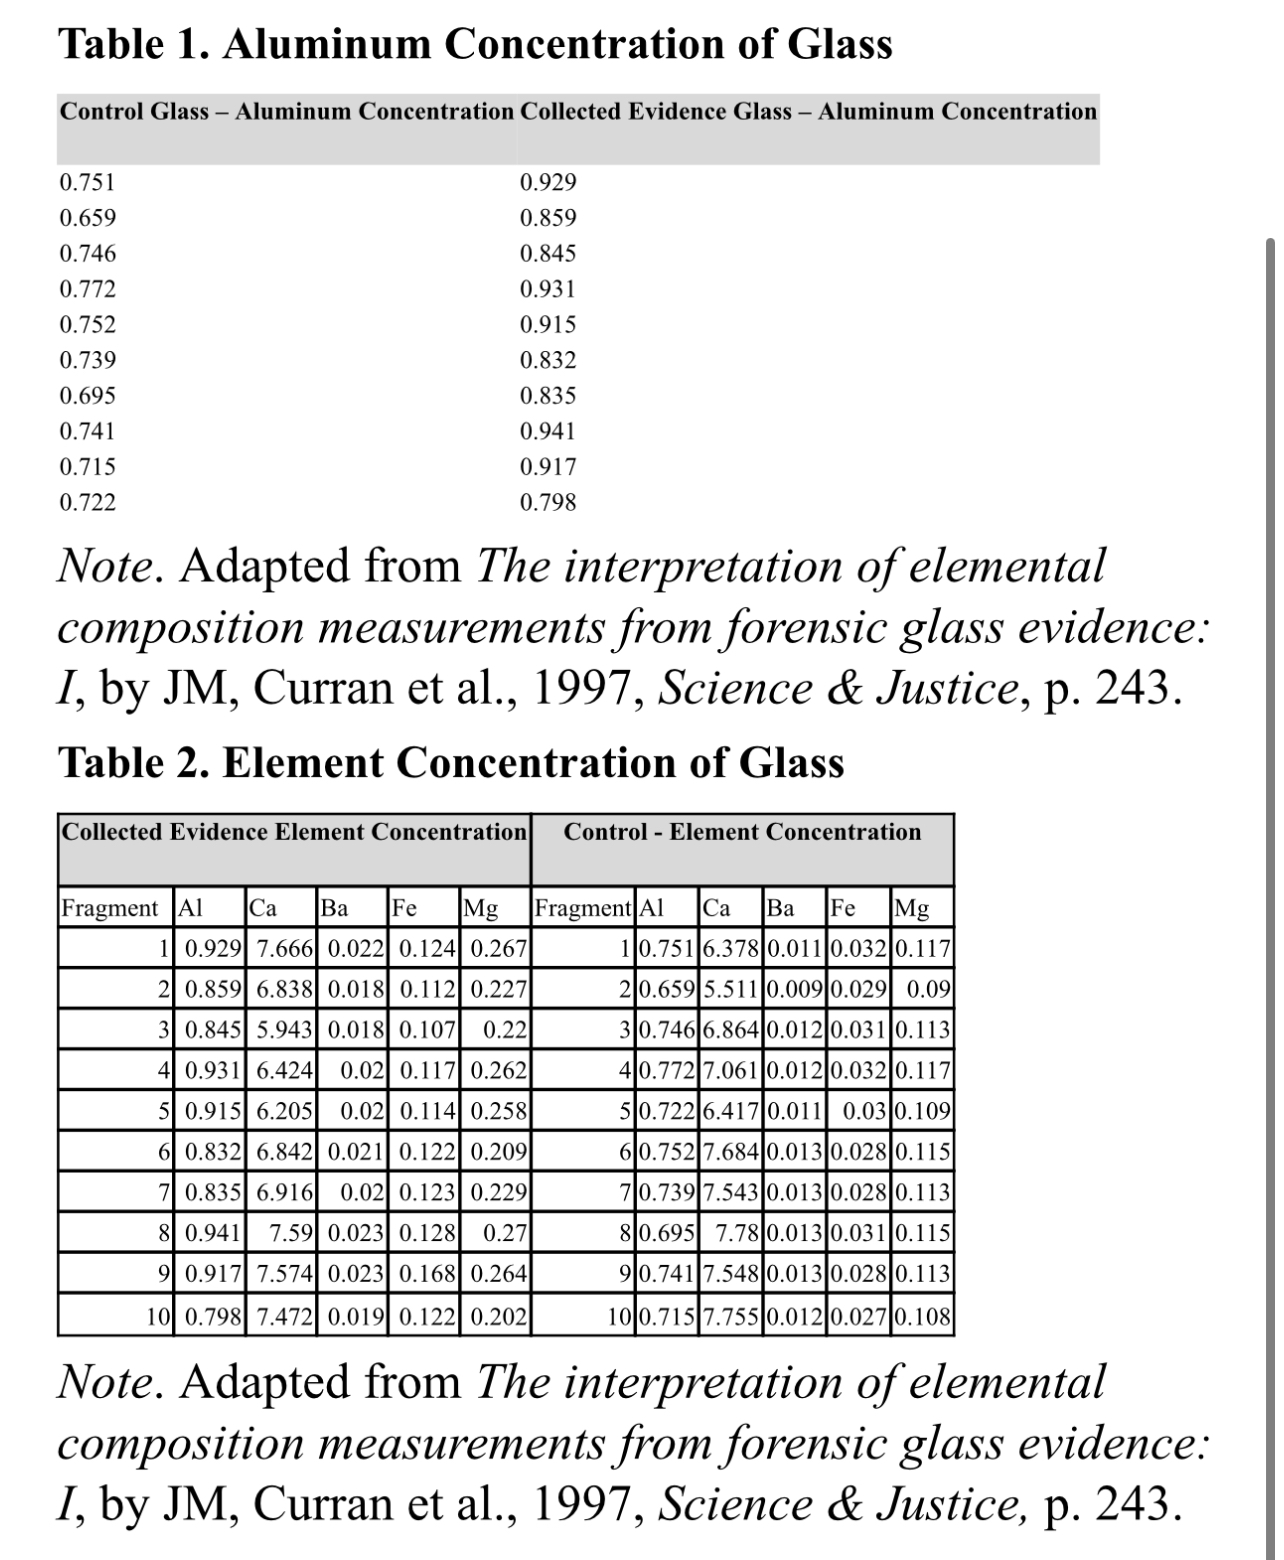
Table 1. Aluminum Concentration of Glass Control Glass - Aluminum Concentration Collected Evidence Glass - Aluminum Concentration 0.751 0.929 0.659 0.859 0.746 0.845 0.772 0.931 0.752 0.915 0.739 0.832 0.695 0.835 0.741 0.941 0.715 0.917 0.722 0.798 Note. Adapted from The interpretation of elemental composition measurements from forensic glass evidence: I, by JM, Curran et al., 1997, Science & Justice, p. 243. Table 2. Element Concentration of Glass Collected Evidence Element Concentration Control - Element Concentration Fragment Al Ca Ba Fe Mg Fragment Al Ca Ba Fe g 0.929 7.666 0.022 0.124 0.267 1 0.751 6.378 0.011 0.032 0.117 21 0.859 6.838 0.018 0.112 0.227 10.659 5.511 0.009 0.029 0.0 31 0.845 5.943 0.018 0.107 0.22 310.746 6. 6 6.864 0.012 0.031 0.113 41 0.931 6.424 ).02 0.117 0.262 10.772 7.061 0.012 0.032 0.117 5 0.915 6.205 0.02 0.114 0.258 0.722 6.417 0.011 0.03 6 0.832 6.842 0.021 0.122 0.209 60.752 7.684 0.013 0.028 0.115 7 0.835 6.916 0.02 0.123 0.229 0.739 7.543 0.013 0.028 0.113 3 0.941 7.59 0.023 0.128 0.27 310.695 7.78 0.013 0.031 0.115 0.917 7 7.574 0.023 0.168 0.264 |0.741 7.548 0.013 0.028 0.113 10 0.798 7.472 0.019 0.122 0.202 10 0.715 7.755 0.012 0.027 0.108 Note. Adapted from The interpretation of elemental composition measurements from forensic glass evidence: I, by JM, Curran et al., 1997, Science & Justice, p. 243
Step by Step Solution
There are 3 Steps involved in it

Get step-by-step solutions from verified subject matter experts