Question: choose the correct answer 11. The graph below shows the number of items produced and sold in each minute. At which minute the amount of

choose the correct answer choose the correct answer 11. The graph below
11. The graph below shows the number of items produced and sold in each minute. At which minute the amount of inventory is the highest? 40 35 Items Produced Items Sold 30- 25 20 15 10 5 0 0 2 4 6 8 10 12 14 16 18 20 22 24 26 28 30 Mrute (b) 8 (c) 13 (d) 17 (e) 21 12. In the previous question, at which minute the amount of inventory is the lowest? (A) 26 (b) 27 (c) 14 (d) 17 e) 21

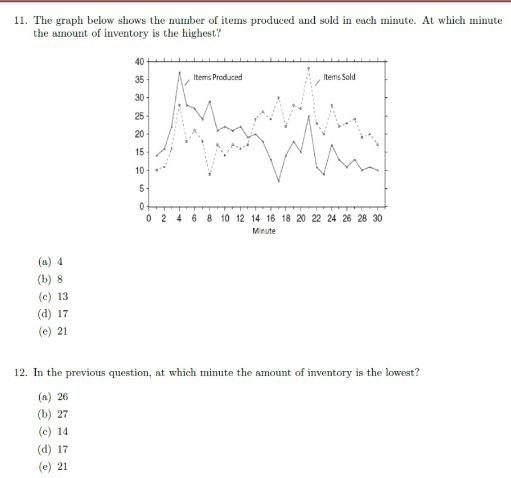
Step by Step Solution

There are 3 Steps involved in it

1 Expert Approved Answer
Step: 1 Unlock blur-text-image
Question Has Been Solved by an Expert!

Get step-by-step solutions from verified subject matter experts

Step: 2 Unlock
Step: 3 Unlock

Students Have Also Explored These Related General Management Questions!