

Question: Suppose a survey of adults and teens (ages 12-17) in a certain country was conducted to determine the number of texts sent in a
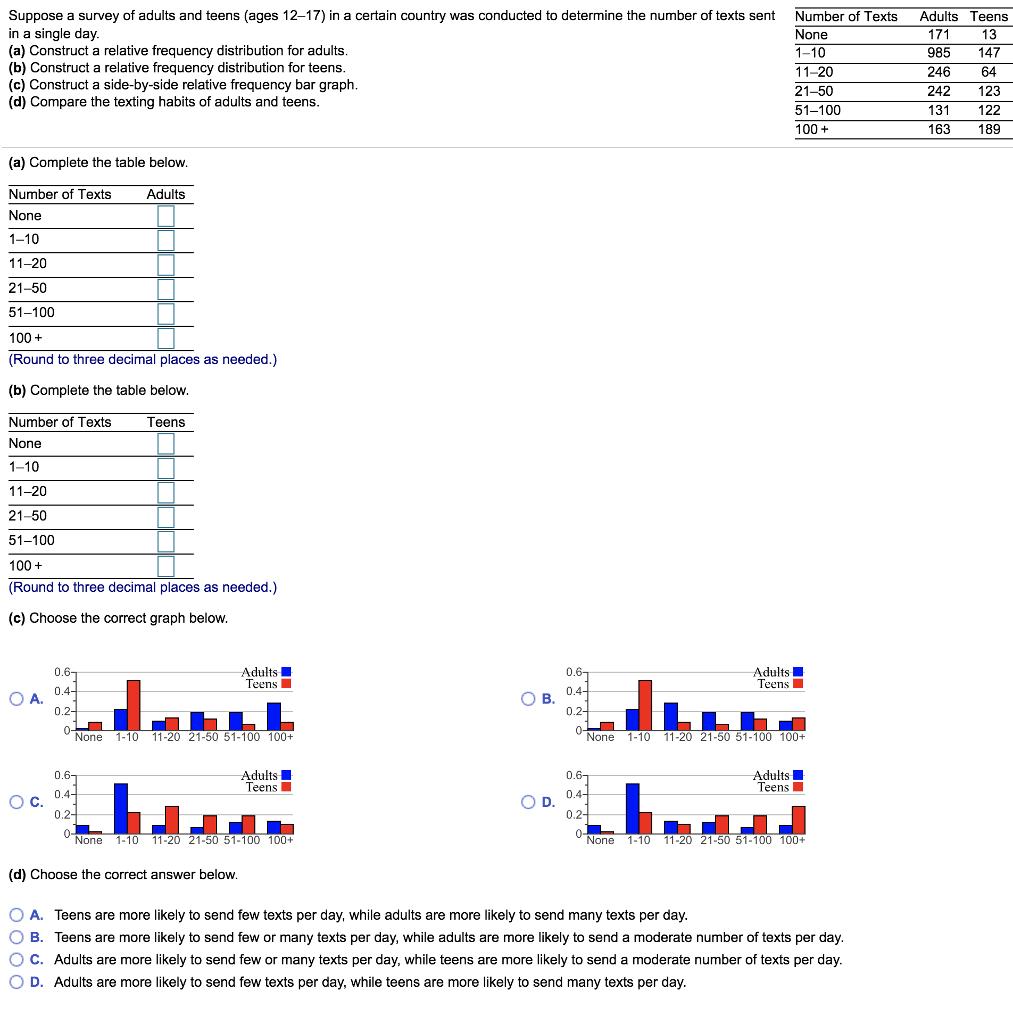
Suppose a survey of adults and teens (ages 12-17) in a certain country was conducted to determine the number of texts sent in a single day. (a) Construct a relative frequency distribution for adults. (b) Construct a relative frequency distribution for teens. (c) Construct a side-by-side relative frequency bar graph. (d) Compare the texting habits of adults and teens. Number of Texts Adults Teens None 171 13 1-10 11-20 21-50 51-100 985 246 147 64 242 123 131 122 100 + 163 189 (a) Complete the table below. Number of Texts Adults None 1-10 11-20 21-50 51-100 100 + (Round to three decimal places as needed.) (b) Complete the table below. Number of Texts Teens None 1-10 11-20 21-50 51-100 100 + (Round to three decimal places as needed.) (c) Choose the correct graph below. Adults Teens I 0.6- 0.6- Adults Teens 0.4- OA. 0.4- O B. 0.2- 0.2- 0- None 1-10 11-20 21-50 51-100 100+ 0- None 1-10 11-20 21-50 51-100 100+ Adults Teens 0.6- 0.6- Adults Teens I 0.4- C. 0.2- 0.4- OD. 0.2- O 0- None 1-10 11-20 21-50 51-100 100+ 0- None 1-10 11-20 21-50 51-100 100+ (d) Choose the correct answer below. O A. Teens are more likely to send few texts per day, while adults are more likely to send many texts per day. O B. Teens are more likely to send few or many texts per day, while adults are more likely to send a moderate number of texts per day. O C. Adults are more likely to send few or many texts per day, while teens are more likely to send a moderate number of texts per day. O D. Adults are more likely to send few texts per day, while teens are more likely to send many texts per day.
Step by Step Solution
3.46 Rating (153 Votes )
There are 3 Steps involved in it
this a constrict a velative frequeny distributien for adult... View full answer

Get step-by-step solutions from verified subject matter experts