

Question: Choose the correct graph of future value as a function of time and rate. Note: blue line is for 0%, orange line is for 6%,
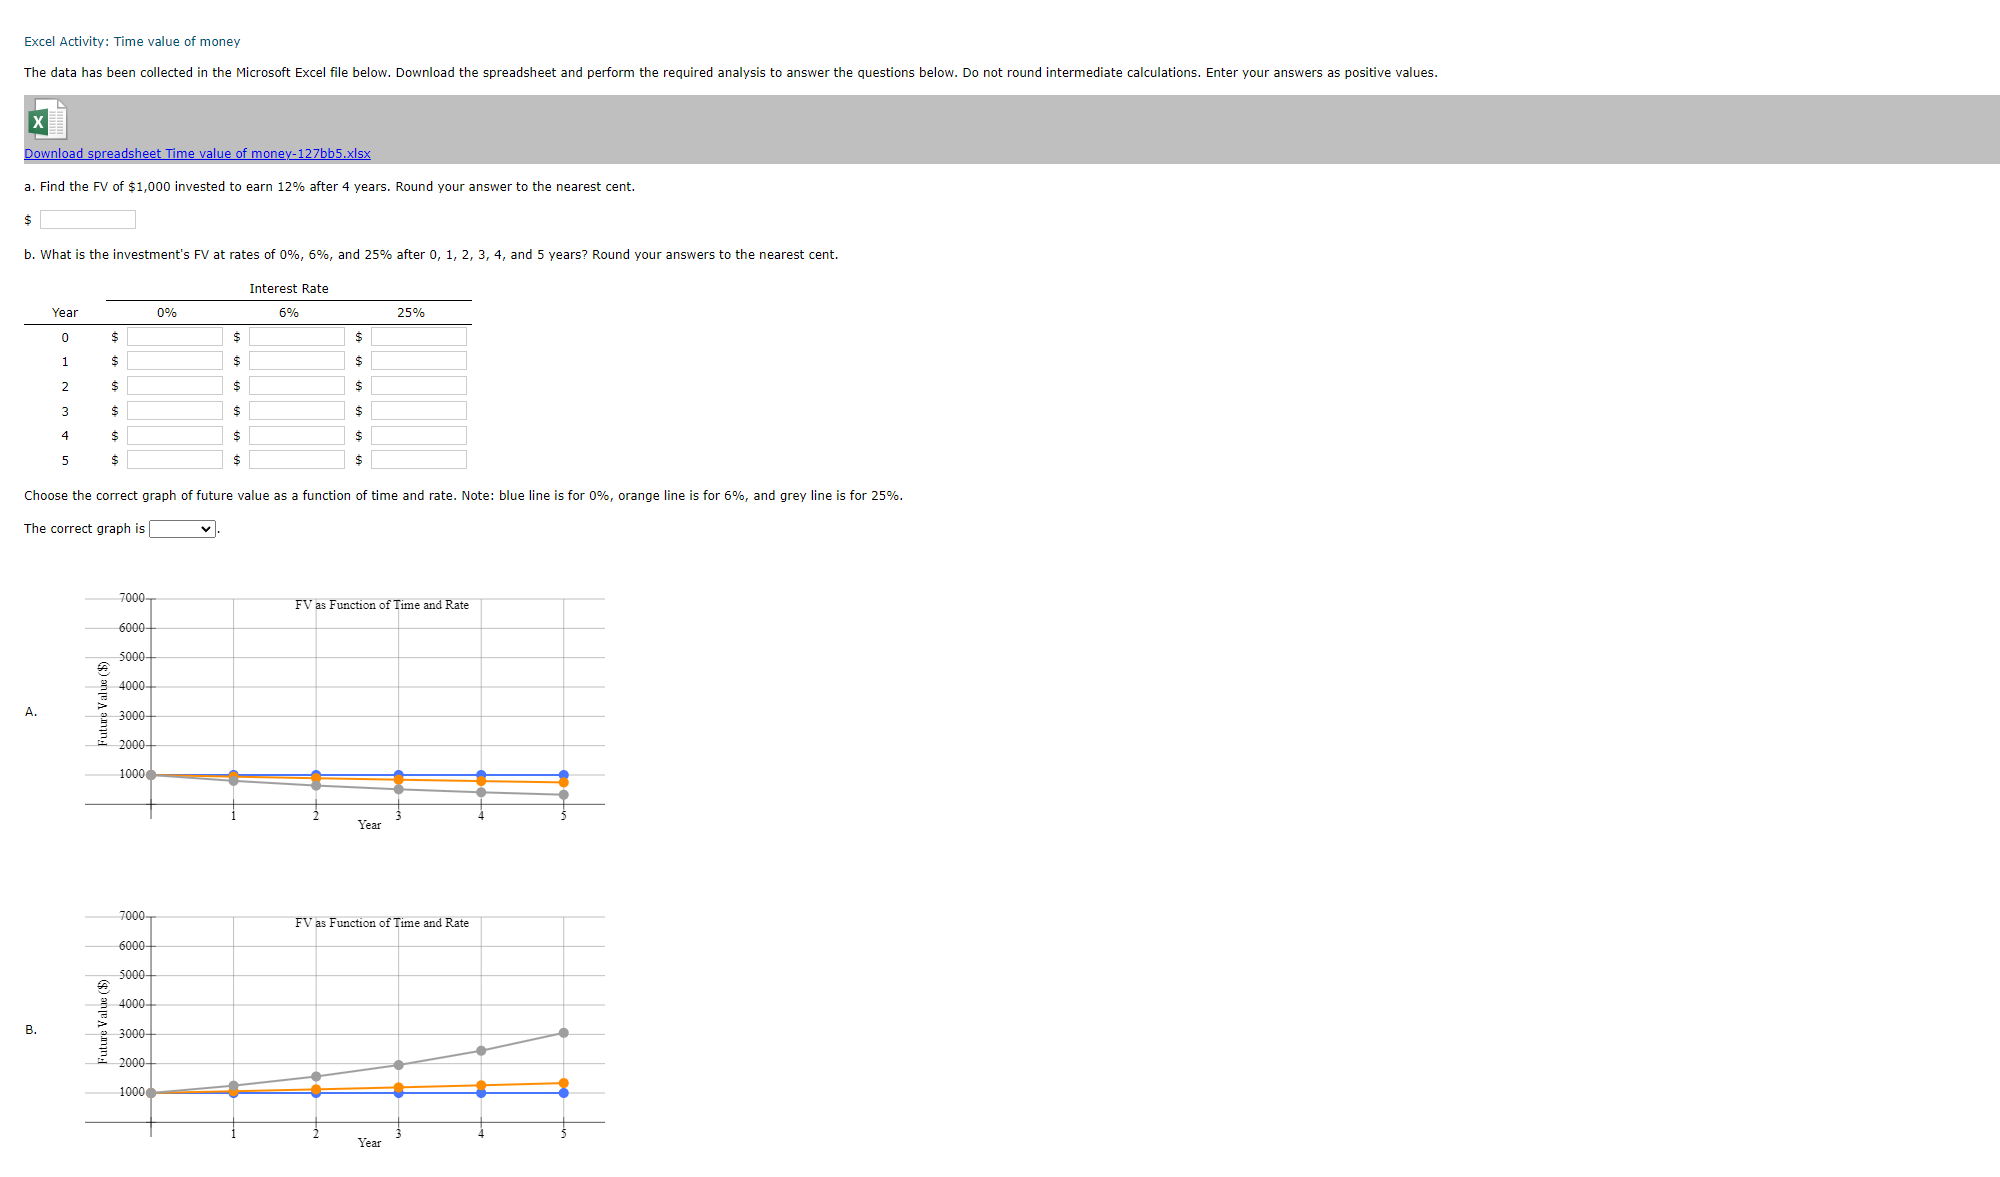
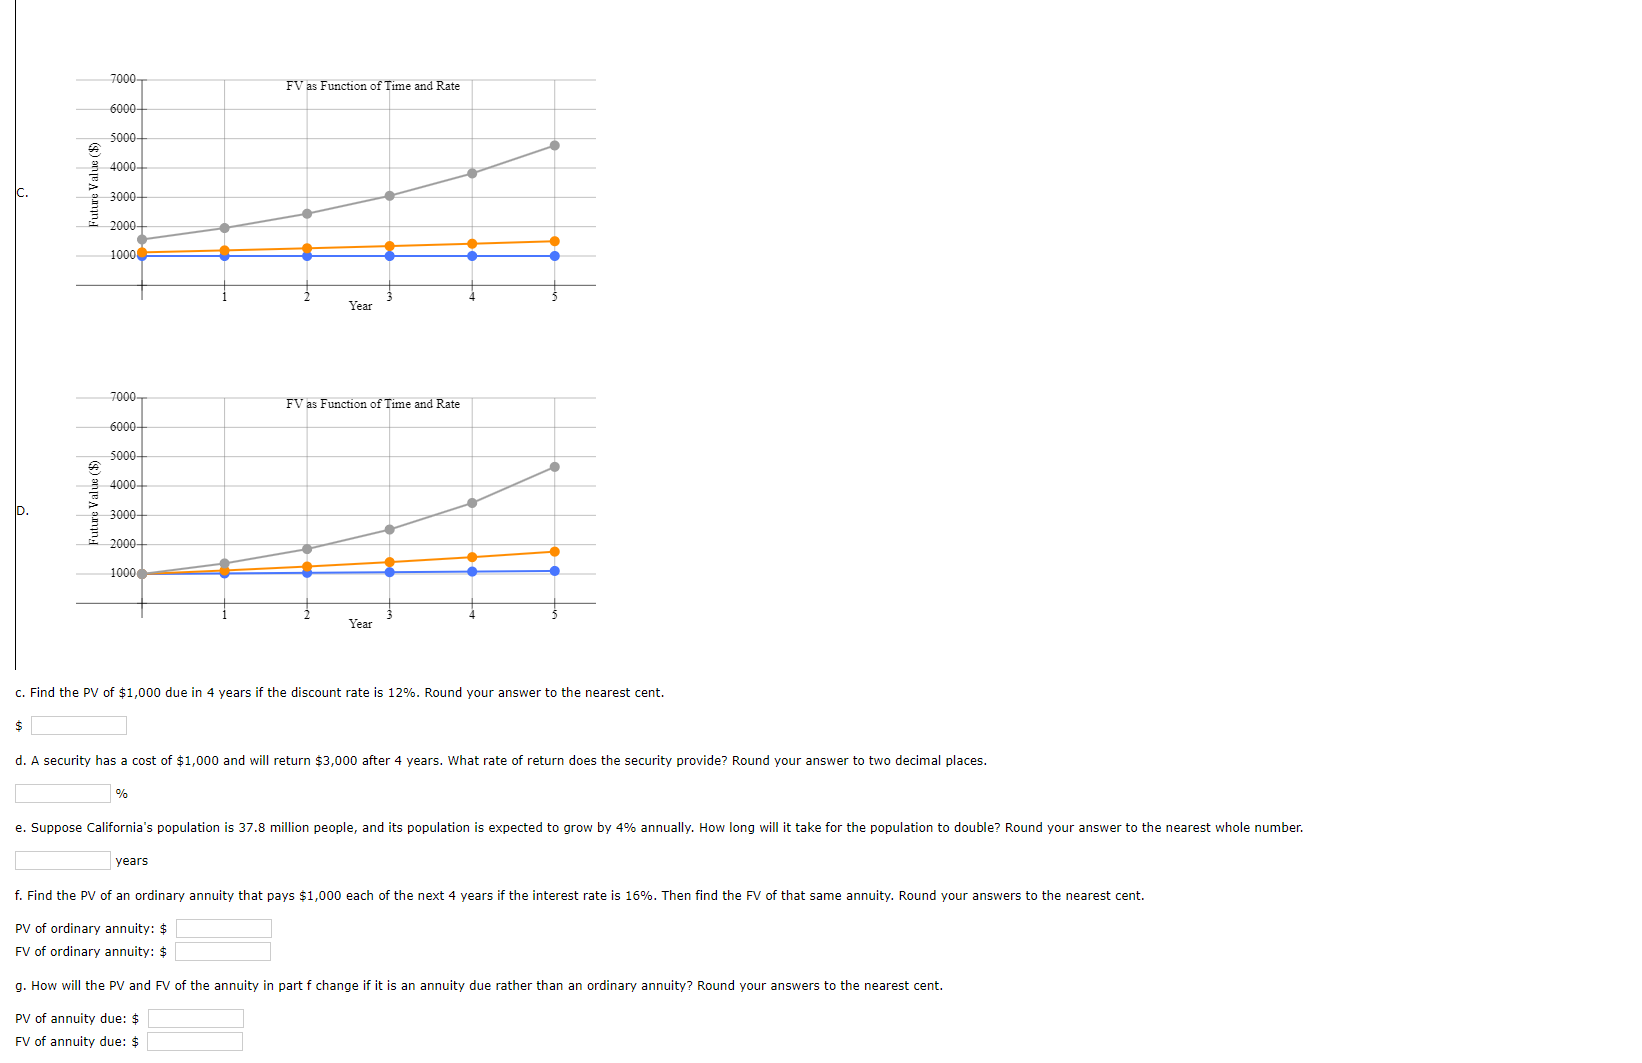
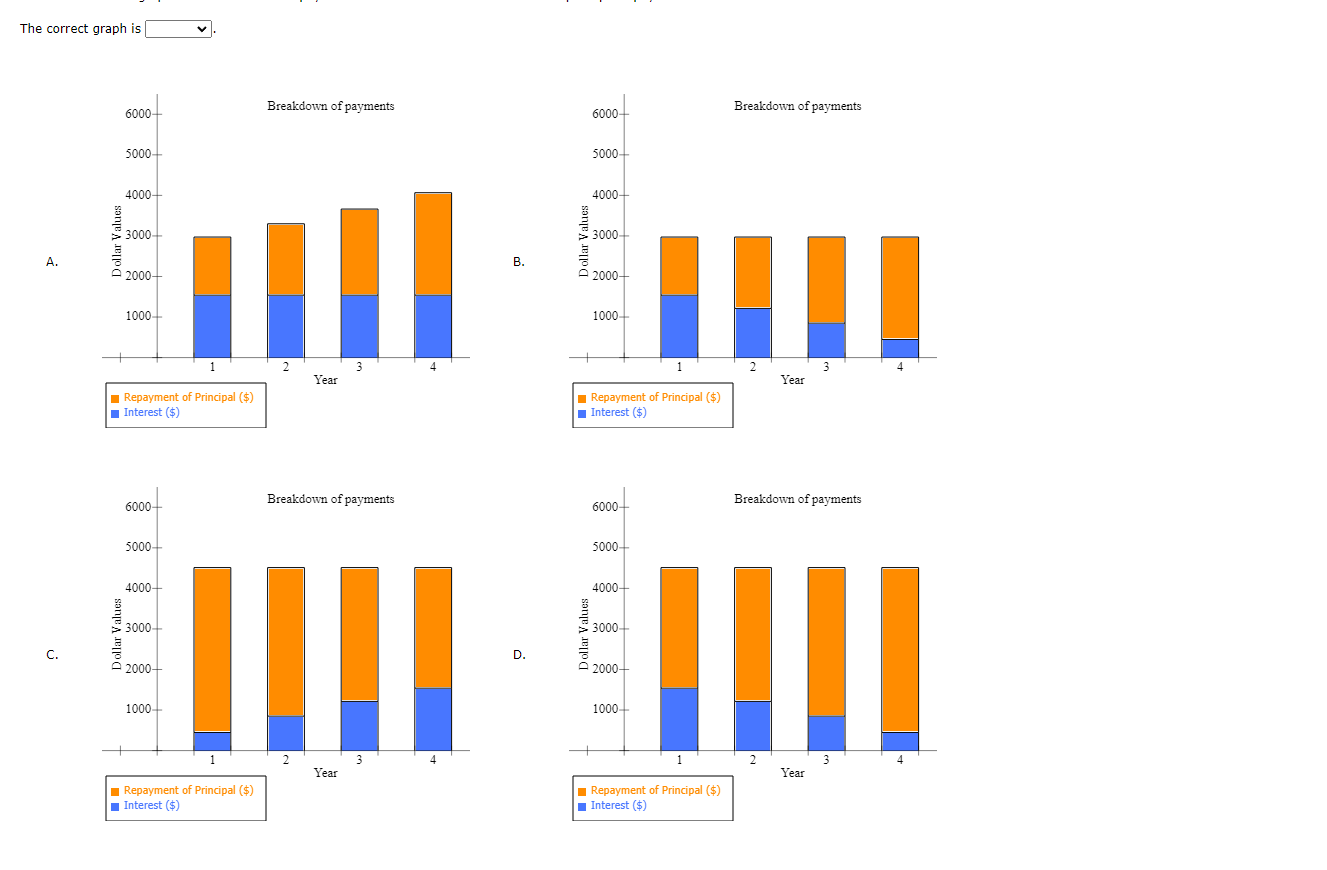
Choose the correct graph of future value as a function of time and rate. Note: blue line is for 0%, orange line is for 6%, and grey line is for 25%. The correct graph is c. Find the PV of $1,000 due in 4 years if the discount rate is 12%. Round your answer to the nearest cent. $ d. A security has a cost of $1,000 and will return $3,000 after 4 years. What rate of return does the security provide? Round your answer to two decimal places. % years f. Find the PV of an ordinary annuity that pays $1,000 each of the next 4 years if the interest rate is 16%. Then find the FV of that same annuity. Round your answers to the nearest cent. PV of ordinary annuity: $ FV of ordinary annuity: $ g. How will the PV and FV of the annuity in part f change if it is an annuity due rather than an ordinary annuity? Round your answers to the nearest cent. PV of annuity due: $ FV of annuity due: \$ FV with semiannual compounding: \$ PV with semiannual compounding: \$ Annual payment for ordinary annuity: $ Annual payment for annuity due: $ j. Find the PV and the FV of an investment that makes the following end-of-year payments. The interest rate is 11%. Round your answers to the nearest cent. PV of investment: \$ FV of investment: \$ 4. Even if the five banks provided the same effective annual rate, would a rational investor be indifferent between the banks? It is more likely that an investor would prefer the bank that compounded frequently. Choose the correct graph that shows how the payments are divided between interest and principal repayment over time. The correct graph is The correct graph is
Step by Step Solution
There are 3 Steps involved in it

Get step-by-step solutions from verified subject matter experts