

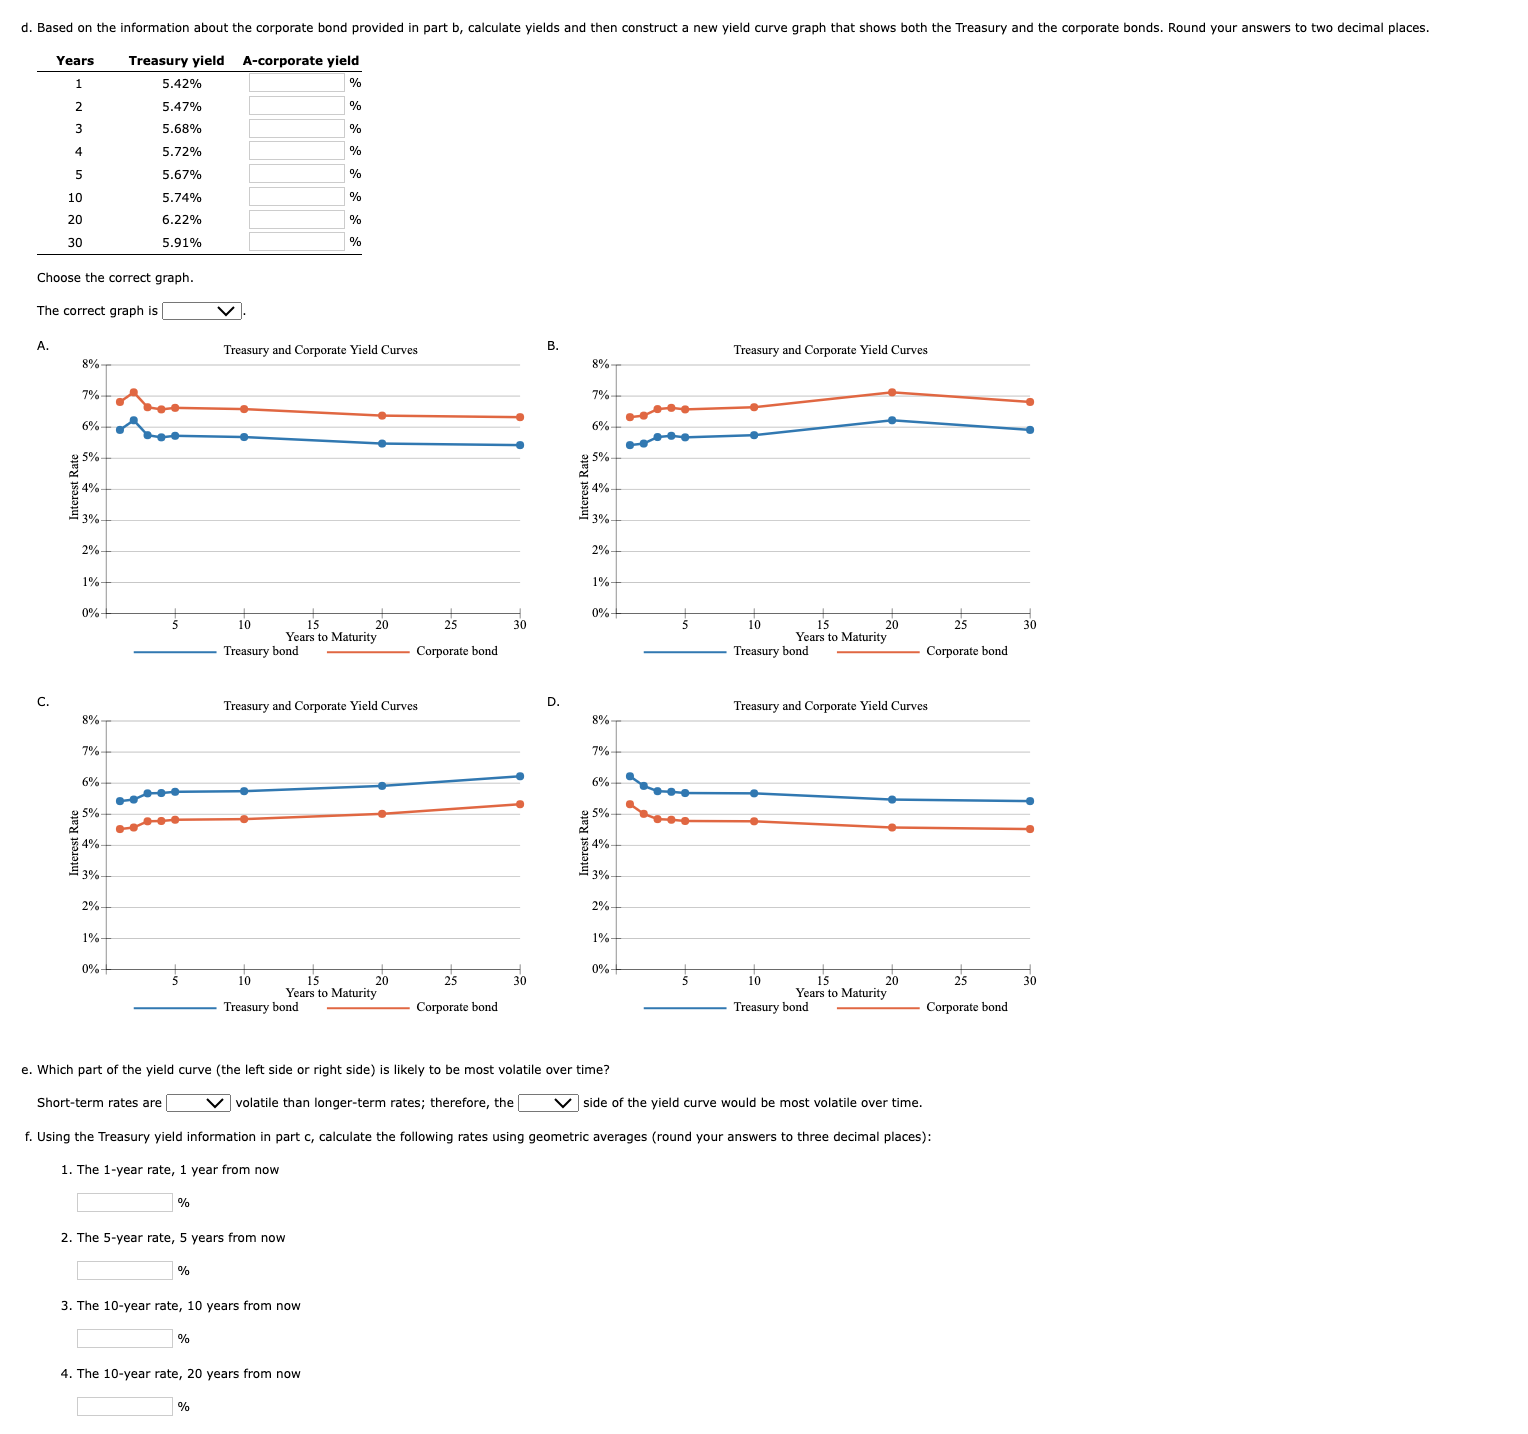
Question: Choose the correct graph. The correct graph is | . A B . C . D . e . Which part of the yield curve
Choose the correct graph.
The correct graph is
A
B
C
D
e Which part of the yield curve the left side or right side is likely to be most volatile over time?
Shortterm rates are
volatile than longerterm rates; therefore, the
side of the yield curve would be most volatile over time.
f Using the Treasury yield information in part c calculate the following rates using geometric averages round your answers to three decimal places:
The year rate, year from now
The year rate, years from now
The year rate, years from now
The year rate, years from now
Step by Step Solution
There are 3 Steps involved in it
1 Expert Approved Answer
Step: 1 Unlock

Question Has Been Solved by an Expert!
Get step-by-step solutions from verified subject matter experts
Step: 2 Unlock
Step: 3 Unlock