

Question: Choose the correct X chart below. A. Choose the correct R chart below. A. AnderSet Laboratories produces rough lenses that will ultimately be ground into
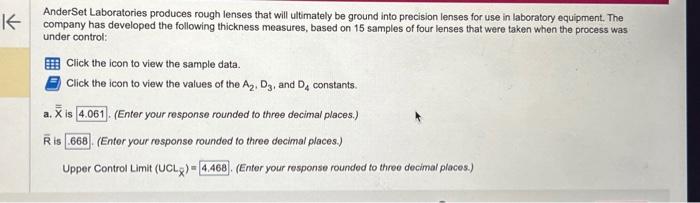
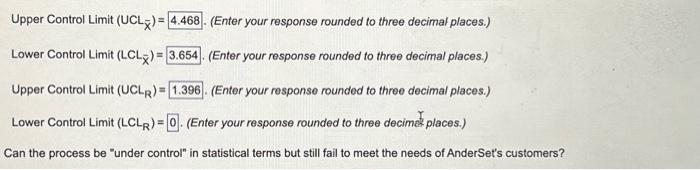
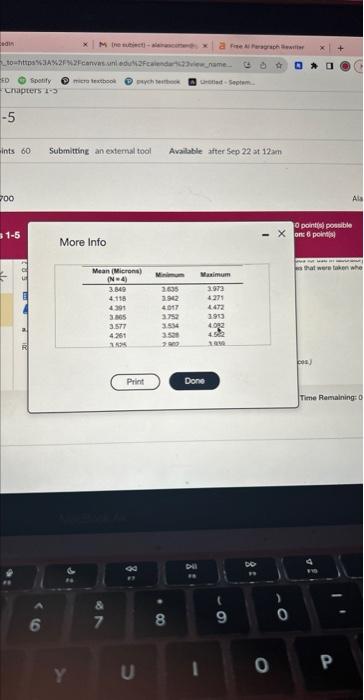
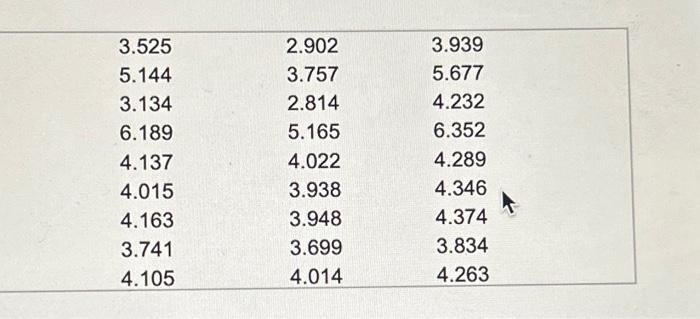
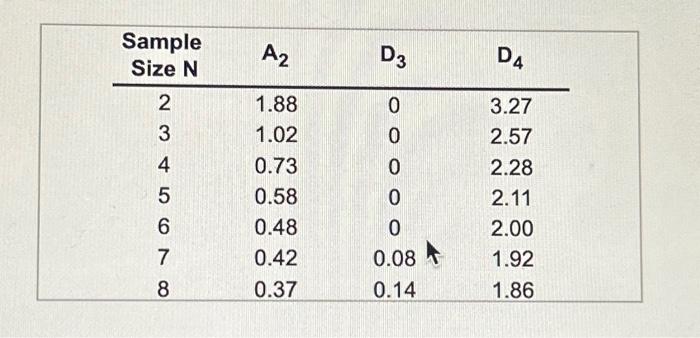
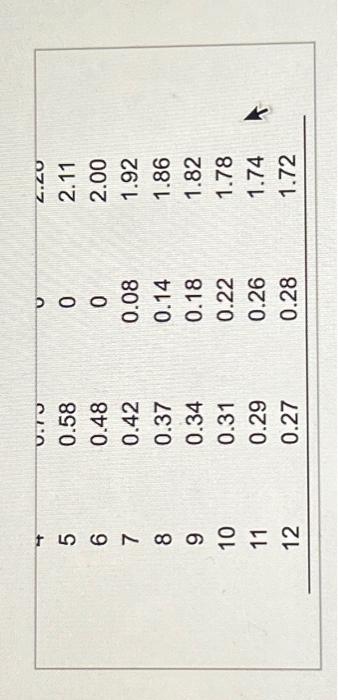
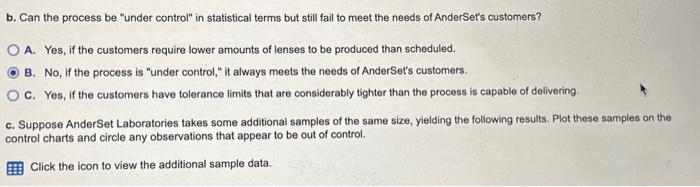
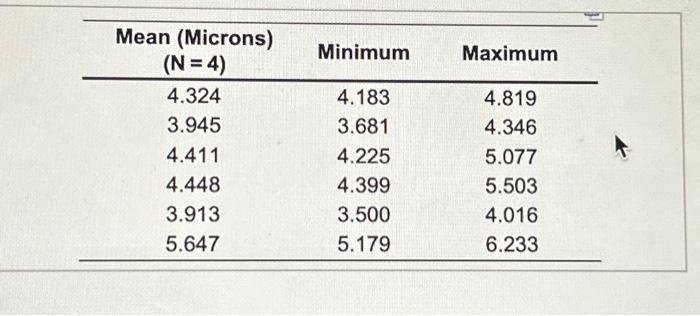
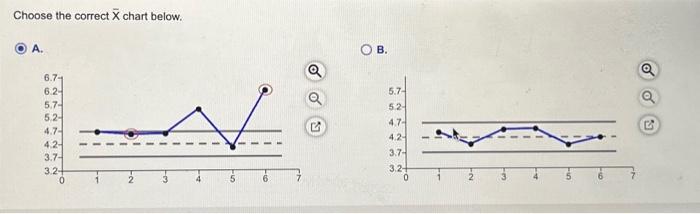
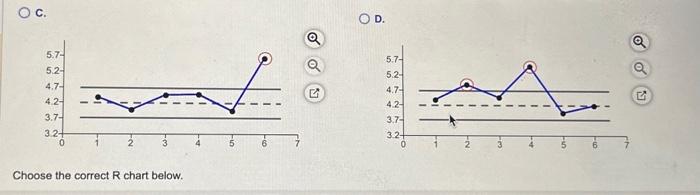
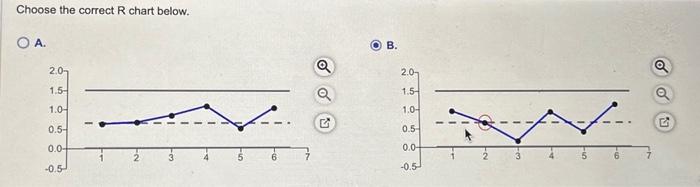
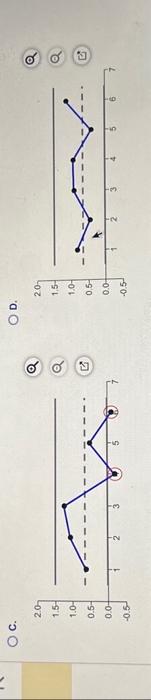
Choose the correct X chart below. A. Choose the correct R chart below. A. AnderSet Laboratories produces rough lenses that will ultimately be ground into precision lenses for use in laboratory equipment. The company has developed the following thickness measures, based on 15 samples of four lenses that were taken when the process was under control: Click the icon to view the sample data. Click the icon to view the values of the A2,D3, and D4 constants. a. X is (Enter your response rounded to three decimal places.) R is (Enter your response rounded to three decimal places.) Upper Control Limit (UCLX)= ( (Enter your response rounded to three decimal places.) Choose the correct R chart below. \begin{tabular}{lll|} 3.525 & 2.902 & 3.939 \\ 5.144 & 3.757 & 5.677 \\ 3.134 & 2.814 & 4.232 \\ 6.189 & 5.165 & 6.352 \\ 4.137 & 4.022 & 4.289 \\ 4.015 & 3.938 & 4.346 \\ 4.163 & 3.948 & 4.374 \\ 3.741 & 3.699 & 3.834 \\ 4.105 & 4.014 & 4.263 \\ \hline \end{tabular} 0 \begin{tabular}{|cccc|} \hline SampleSizeN & A2 & D3 & D4 \\ \hline 2 & 1.88 & 0 & 3.27 \\ 3 & 1.02 & 0 & 2.57 \\ 4 & 0.73 & 0 & 2.28 \\ 5 & 0.58 & 0 & 2.11 \\ 6 & 0.48 & 0 & 2.00 \\ 7 & 0.42 & 0.08 & 1.92 \\ 8 & 0.37 & 0.14 & 1.86 \\ \hline \end{tabular} \begin{tabular}{|cccc|} \hline 5 & 0.10 & 0 & <.0 b. can the process be control in statistical terms but still fail to meet needs of anderset customers a. yes if require lower amounts lenses produced than scheduled. no is it always meets customers. c. have tolerance limits that are considerably tighter capable delivering suppose laboratories takes some additional samples same size yielding following results. plot these on charts and circle any observations appear out control. click icon view sample data. mean minimum maximum upper limit your response rounded three decimal places. lr decimat more info>
Step by Step Solution
There are 3 Steps involved in it

Get step-by-step solutions from verified subject matter experts