

Question: Choose the Top 100 public Colleges 2003 Data Set for this project. The goal of this project is to compare the top 50 schools with
Choose the Top 100 public Colleges 2003 Data Set for this project.
The goal of this project is to compare the top 50 schools with
the bottom 50 schools.
Choose two variables in the data file to compare.
Presentation to compare the top 50 colleges (in-state ranking)
on this list with the second 50 colleges on this list.Include, at
minimum, the following in this presentation ( BOTH the top 50 and bottom 50
schools):
(1) An appropriate graphical representation of the data
(2) Stem-and-leaf diagrams
(3) Means, medians, standard deviations, and
(4) Boxplots.
There will be total of four items for each listed number
above).
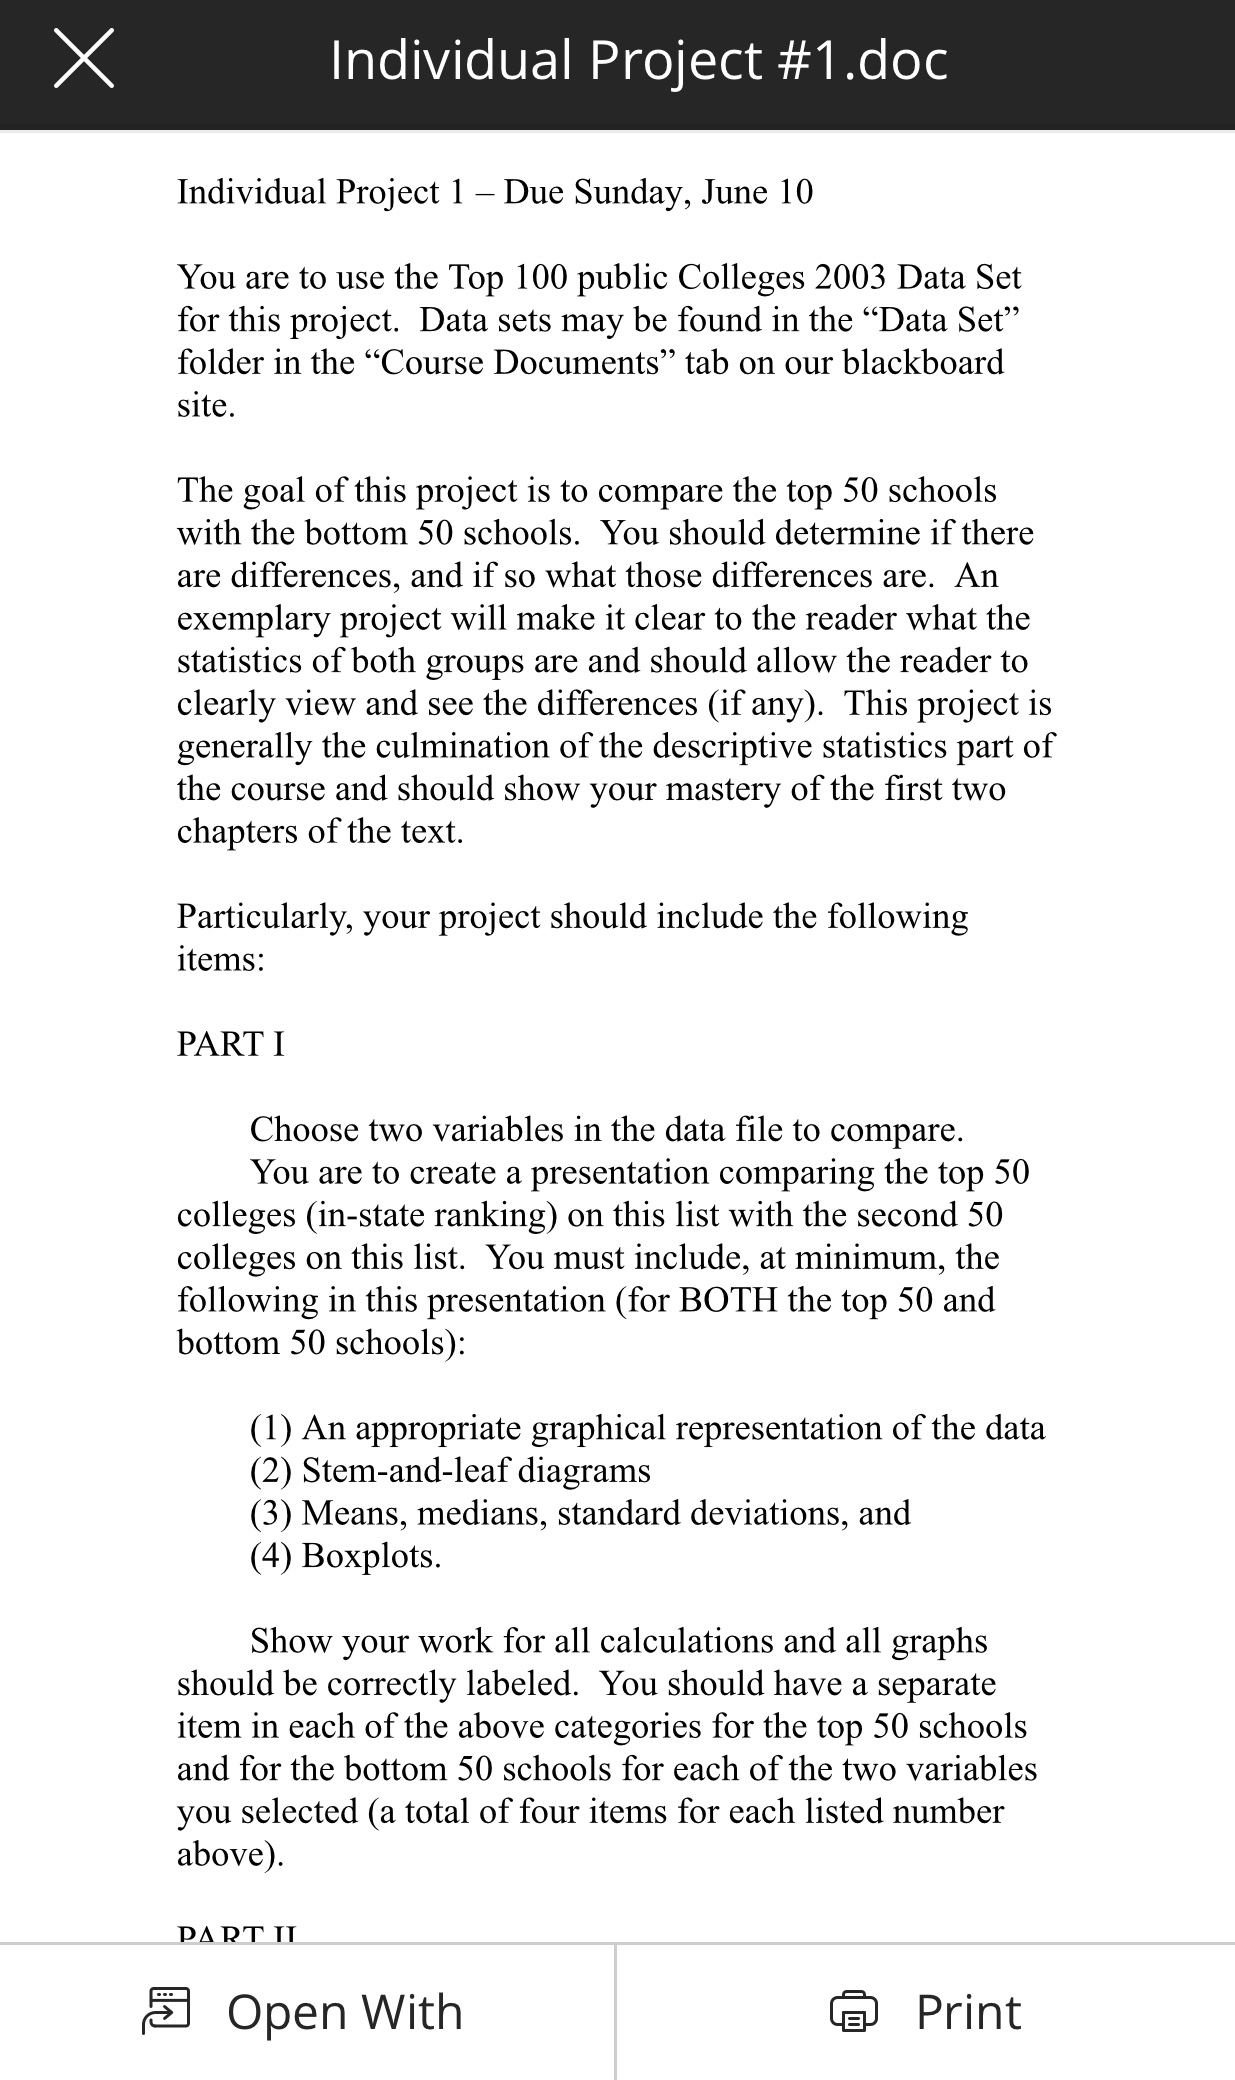
X Individual Project #1 .doc Individual Project 1 7 Due Sunday, June 10 You are to use the Top 100 public Colleges 2003 Data Set for this project. Data sets may be found in the \"Data Set\" folder in the \"Course Documents\" tab on our blackboard site. The goal of this project is to compare the top 50 schools with the bottom 50 schools. You should determine if there are differences, and if so what those differences are. An exemplary project will make it clear to the reader what the statistics of both groups are and should allow the reader to clearly view and see the differences (if any). This project is generally the culmination of the descriptive statistics part of the course and should show your mastery of the first two chapters of the text. Particularly, your project should include the following items: PART I Choose two variables in the data le to compare. You are to create a presentation comparing the top 50 colleges (instate ranking) on this list with the second 50 colleges on this list. You must include, at minimum, the following in this presentation (for BOTH the top 50 and bottom 50 schools): (1) An appropriate graphical representation of the data (2) Stem-and-leaf diagrams (3) Means, medians, standard deviations, and (4) Boxplots. Show your work for all calculations and all graphs should be correctly labeled. You should have a separate item in each of the above categories for the top 50 schools and for the bottom 50 schools for each of the two variables you selected (a total of four items for each listed number above) DAD'T' II El Open With ES] Print
Step by Step Solution
There are 3 Steps involved in it

Get step-by-step solutions from verified subject matter experts