

Question: Chrome - Do Homework - M02: Chapter 3 Homework mathxl.com/Student/PlayerHomework.aspx?homeworkid=599207433&questionld=5&flushed=false&cld=6536040 1P-Summer 2021-Statistics CAFE Jacinta L omework: M02: Chapter 3 Homework core: 0.8 of 1 pt
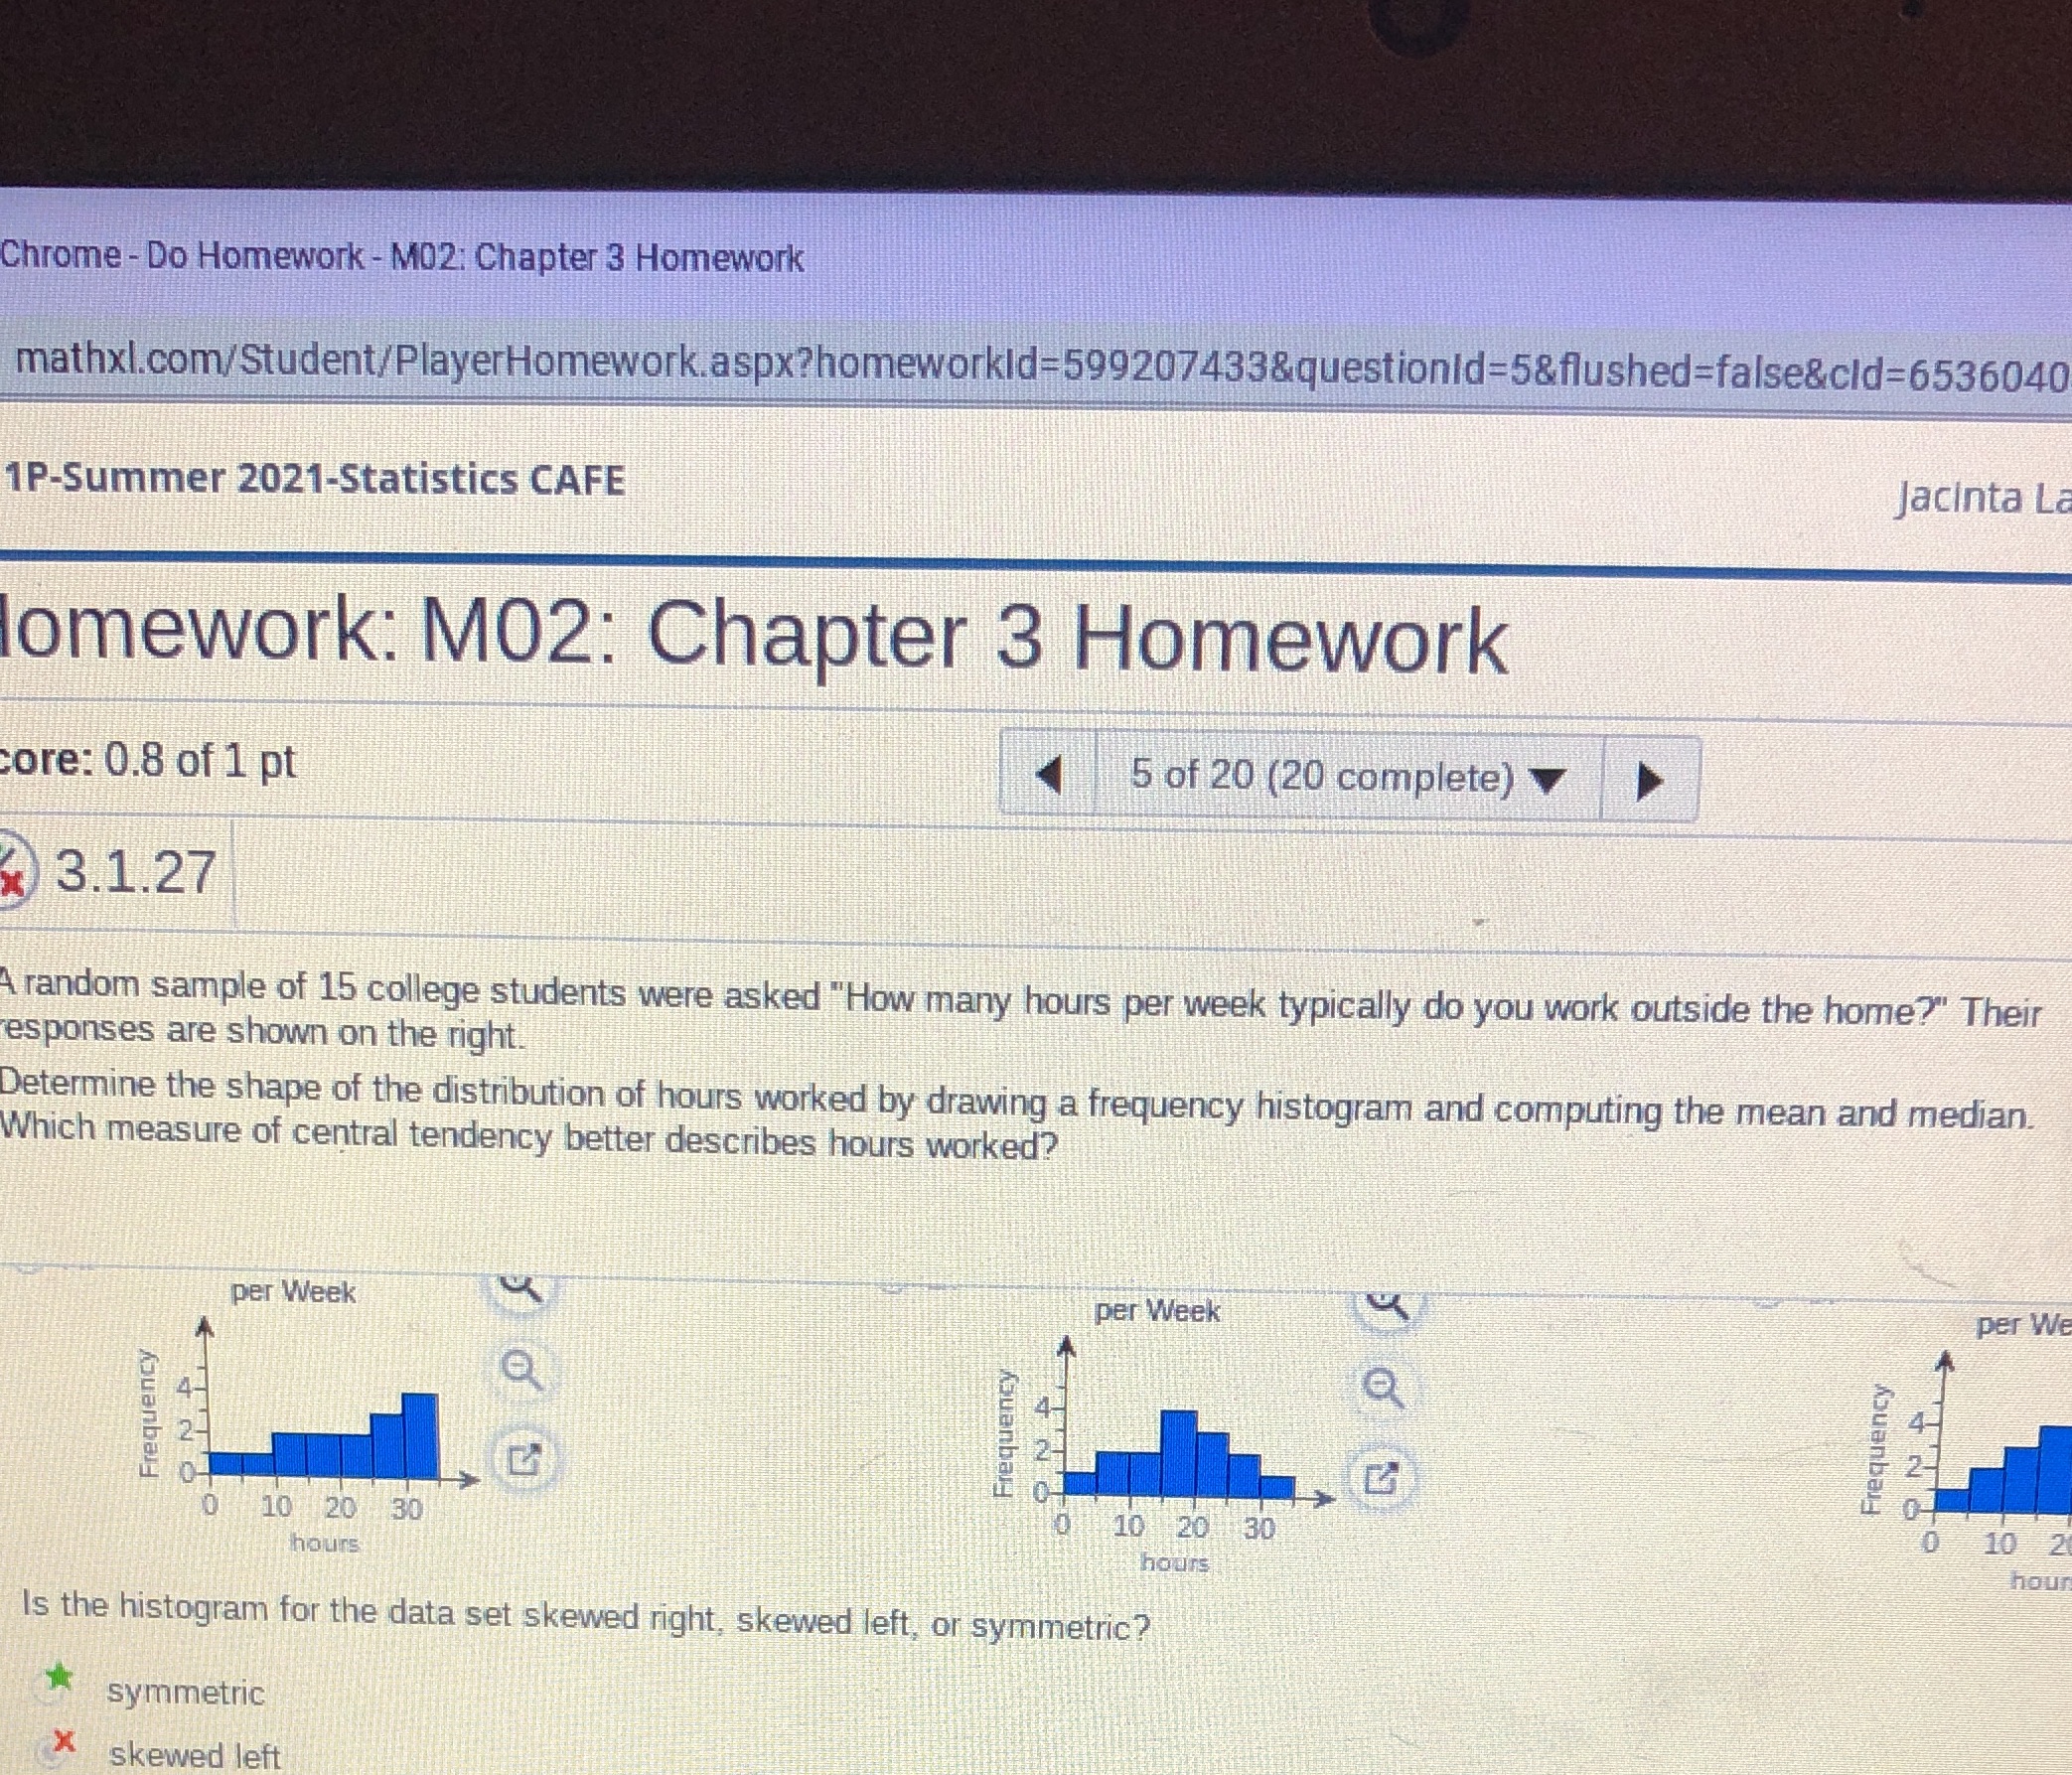
Chrome - Do Homework - M02: Chapter 3 Homework mathxl.com/Student/PlayerHomework.aspx?homeworkid=599207433&questionld=5&flushed=false&cld=6536040 1P-Summer 2021-Statistics CAFE Jacinta L omework: M02: Chapter 3 Homework core: 0.8 of 1 pt 5 of 20 (20 complete) 3.1.27 A random sample of 15 college students were asked "How many hours per week typically do you work outside the home?" Their esponses are shown on the right. Determine the shape of the distribution of hours worked by drawing a frequency histogram and computing the mean and median. Which measure of central tendency better describes hours worked? per Week per Week per W Frequency Frequency 10 20 30 10 20 30 10 hours hours noU Is the histogram for the data set skewed right, skewed left, or symmetric? symmetric X skewed left
Step by Step Solution
There are 3 Steps involved in it

Get step-by-step solutions from verified subject matter experts