

Question: Chrome e Edit View History Bookmarks s Profiles Tab Window Help Sun Feb 12 9:23 PM Taking Cara Babies X Dashboard X D21 Study Plan:
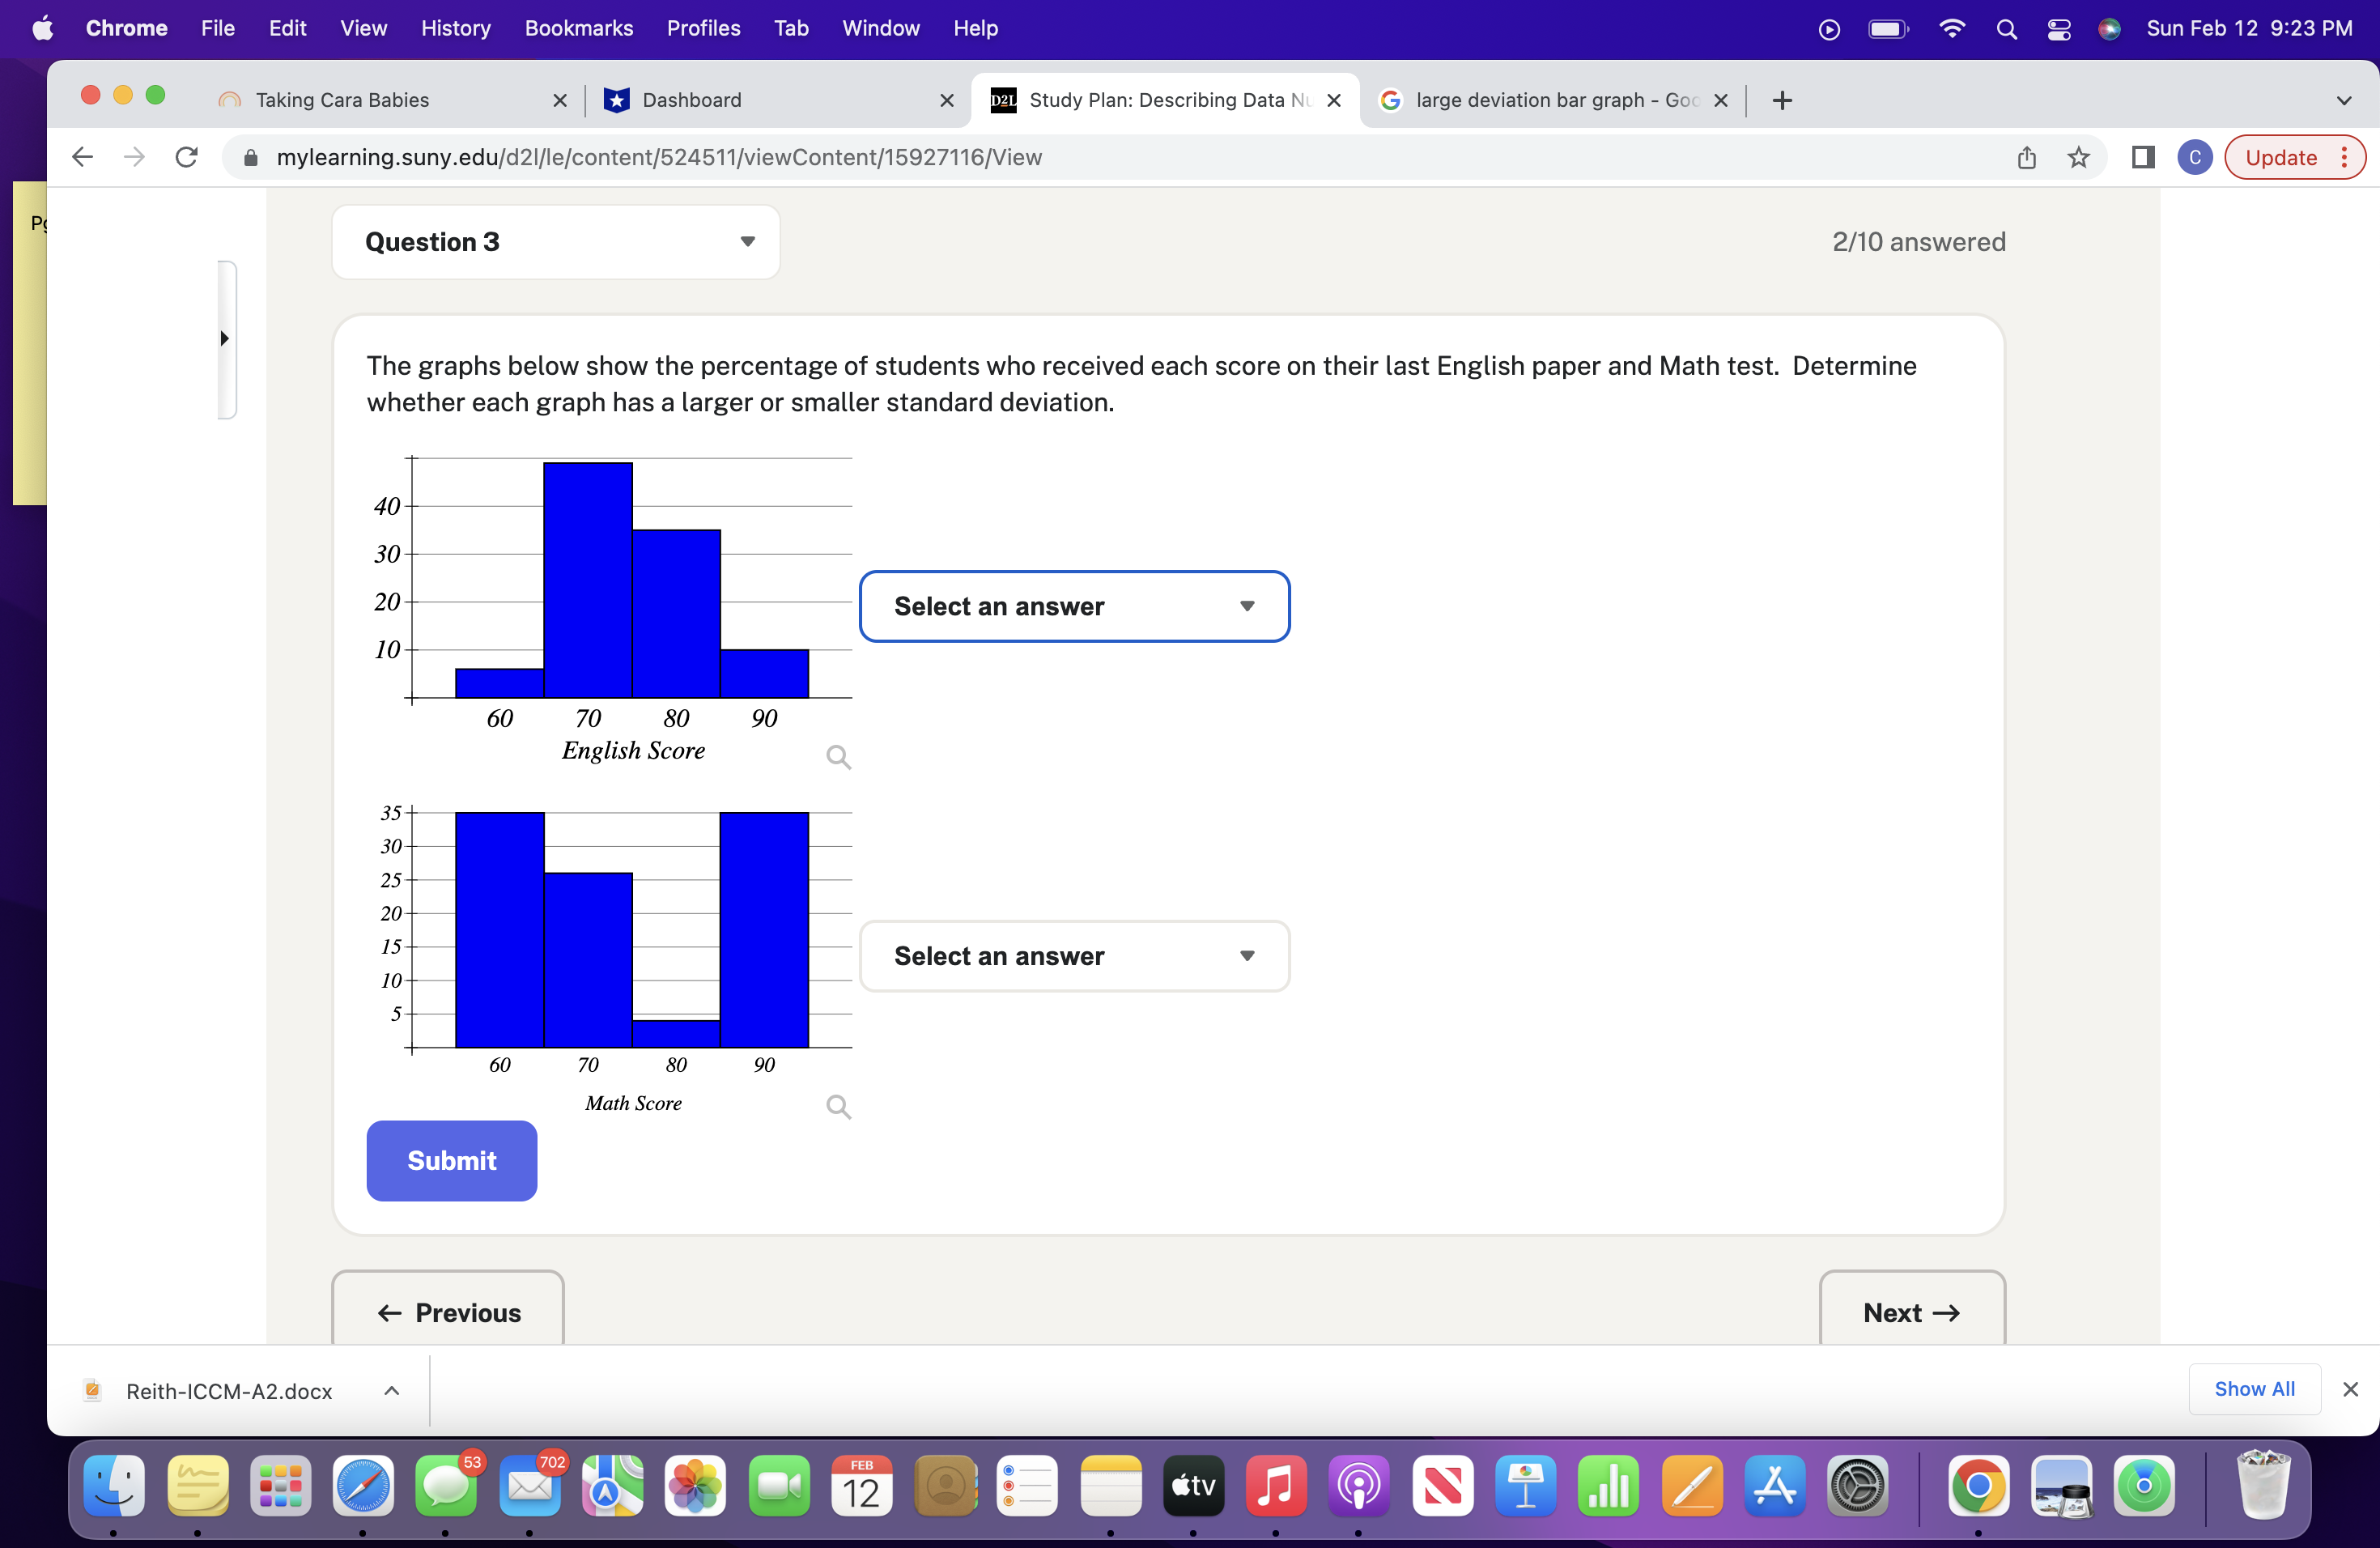
Chrome e Edit View History Bookmarks s Profiles Tab Window Help Sun Feb 12 9:23 PM Taking Cara Babies X Dashboard X D21 Study Plan: Describing Data NL X G large deviation bar graph - Goo x + -> C a mylearning.suny.edu/d21/le/content/524511/viewContent/15927116/View O C Update : P Question 3 2/10 answered The graphs below show the percentage of students who received each score on their last English paper and Math test. Determine whether each graph has a larger or smaller standard deviation. 40 30 20 Select an answer 10 60 70 80 90 English Score Q 35 30- 25- 20- 15- Select an answer 10- u 50 70 80 90 Math Score Q Submit - Previous Next - Reith-ICCM-A2.docx Show All X 53 X 12 O
Step by Step Solution
There are 3 Steps involved in it

Get step-by-step solutions from verified subject matter experts