

Question: Chrome File Edit View History Bookmarks Profiles Tab Window Help CON T )) 100% 27 Wed 6:41 PM Lindsey Kremin Q AutoSave @ OFF 4
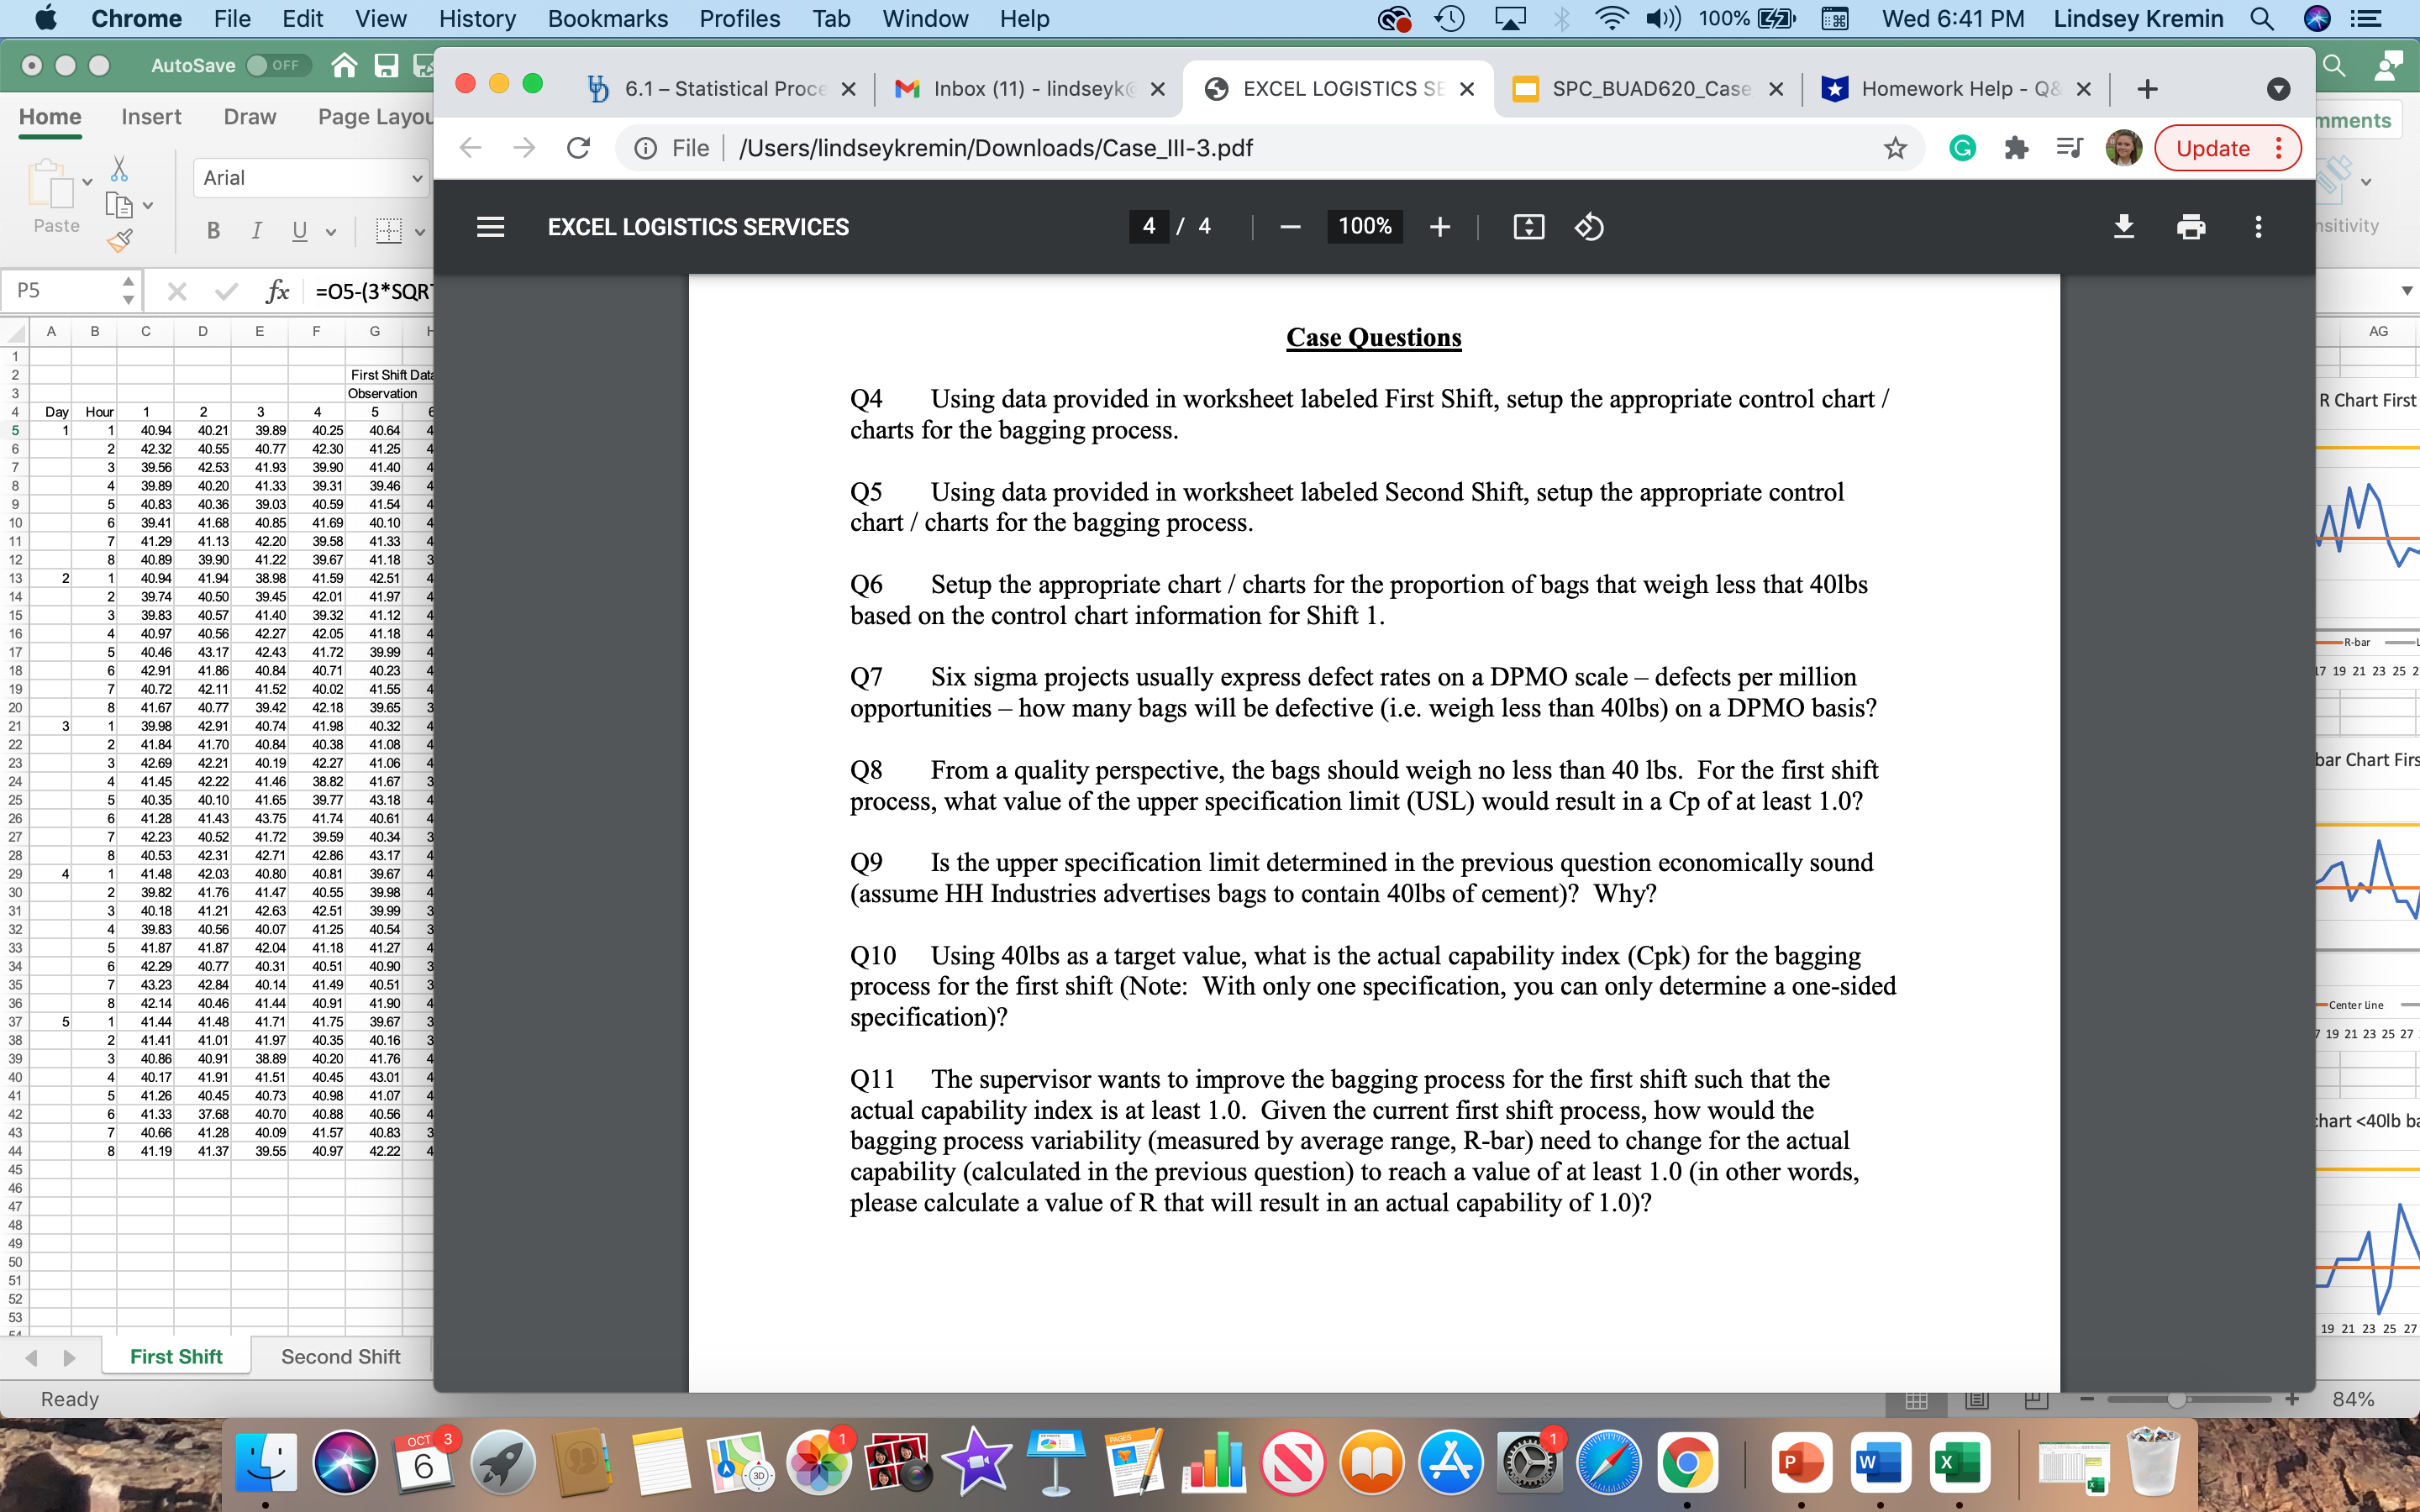
Chrome File Edit View History Bookmarks Profiles Tab Window Help CON T )) 100% 27 Wed 6:41 PM Lindsey Kremin Q AutoSave @ OFF 4 6 .. . 4 6.1 - Statistical Proce x M Inbox (11) - lindseyk( X EXCEL LOGISTICS SE X SPC_BUAD620_Case x Homework Help - Q& x + Home Insert Draw Page Layou ments C @ File | /Users/lindseykremin/Downloads/Case_Ill-3.pdf Update : Aria Paste I UVV E EXCEL LOGISTICS SERVICES 100% + sitivity P5 4 X V fx =05-(3*SQR B C D Case Questions AG First Shift Data Observation Day Hour 1 R Chart First 2 5 Q4 Using data provided in worksheet labeled First Shift, setup the appropriate control chart / 40.94 40.21 39.89 40.25 40.64 42.32 charts for the bagging process. 40.55 40.77 42.30 41.25 AWN - 39.56 42.53 41.93 39.90 41.40 39.89 40.20 41.33 39.31 39.46 40.83 40.36 39.03 40.59 41.54 Q5 Using data provided in worksheet labeled Second Shift, setup the appropriate control 39.41 41.68 40.85 41.69 40.10 41.29 41.13 chart / charts for the bagging process. 42.20 39.58 41.33 8 40.89 39.90 41 22 39.67 41.18 10.94 41.94 38.98 41.59 42.5 39.74 40.50 39.45 42.01 41.97 Q6 Setup the appropriate chart / charts for the proportion of bags that weigh less that 401bs 39.83 40.57 41.40 39.32 41.12 40.97 based on the control chart information for Shift 1. 40.56 42.27 42.05 41.18 40.46 43.17 42.43 41 72 39.99 - R-bar 42.91 41.86 40.84 40.71 40.23 17 19 21 23 25 40.72 42.11 41.52 40.02 41.55 27 Six sigma projects usually express defect rates on a DPMO scale - defects per million 8 41.67 40.77 39.42 42.18 39.65 39.98 40.74 opportunities - how many bags will be defective (i.e. weigh less than 401bs) on a DPMO basis? 42.91 41.98 40.32 41.84 41.70 40.38 41.08 42.69 42.21 40.19 42.27 41.06 bar Chart Firs 41.45 42.22 41.46 38.82 41.67 Q8 From a quality perspective, the bags should weigh no less than 40 lbs. For the first shift 40.35 40.10 41.65 39.77 43.18 41.28 41.43 43.75 41.74 40.61 process, what value of the upper specification limit (USL) would result in a Cp of at least 1.0? 42.23 40.52 41.72 39.59 40.34 40.53 42.31 42.71 42.86 43.17 41.48 42.03 40.80 40.81 39.6 Q9 Is the upper specification limit determined in the previous question economically sound 9.82 41.76 41.47 40.55 39.9 10.18 41.21 42.51 (assume HH Industries advertises bags to contain 401bs of cement)? Why? 42.63 39.9 39.83 40.56 40.07 41.25 40.54 41.87 41.87 42.04 41.18 41.27 42.29 40.77 40.31 40.51 40.9 Q10 Using 401bs as a target value, what is the actual capability index (Cpk) for the bagging 43.23 42.84 40.14 41.49 40.5 42.14 40.46 41.44 40.91 process for the first shift (Note: With only one specification, you can only determine a one-sided 41.9 - Center Line 11.44 41.48 41.71 41.75 39.67 specification)? 41.41 41.01 41.97 40.35 40.1 19 21 23 25 27 40.86 40.91 38.89 40.20 41.76 40.17 41.91 41.51 40.45 43.0 41.26 40.45 40.73 40.98 41.07 Q11 The supervisor wants to improve the bagging process for the first shift such that the VOUA 41.33 37.68 40.70 40.88 40.56 actual capability index is at least 1.0. Given the current first shift process, how would the 40.66 41.28 40.09 40.83 chart
Step by Step Solution
There are 3 Steps involved in it

Get step-by-step solutions from verified subject matter experts