

Question: Chrome File Edit View History Bookmarks Profiles Tab Window Help ED Wed 3:12 PM Q DE ... Cloud Bas X Practice Fi X & Messenger
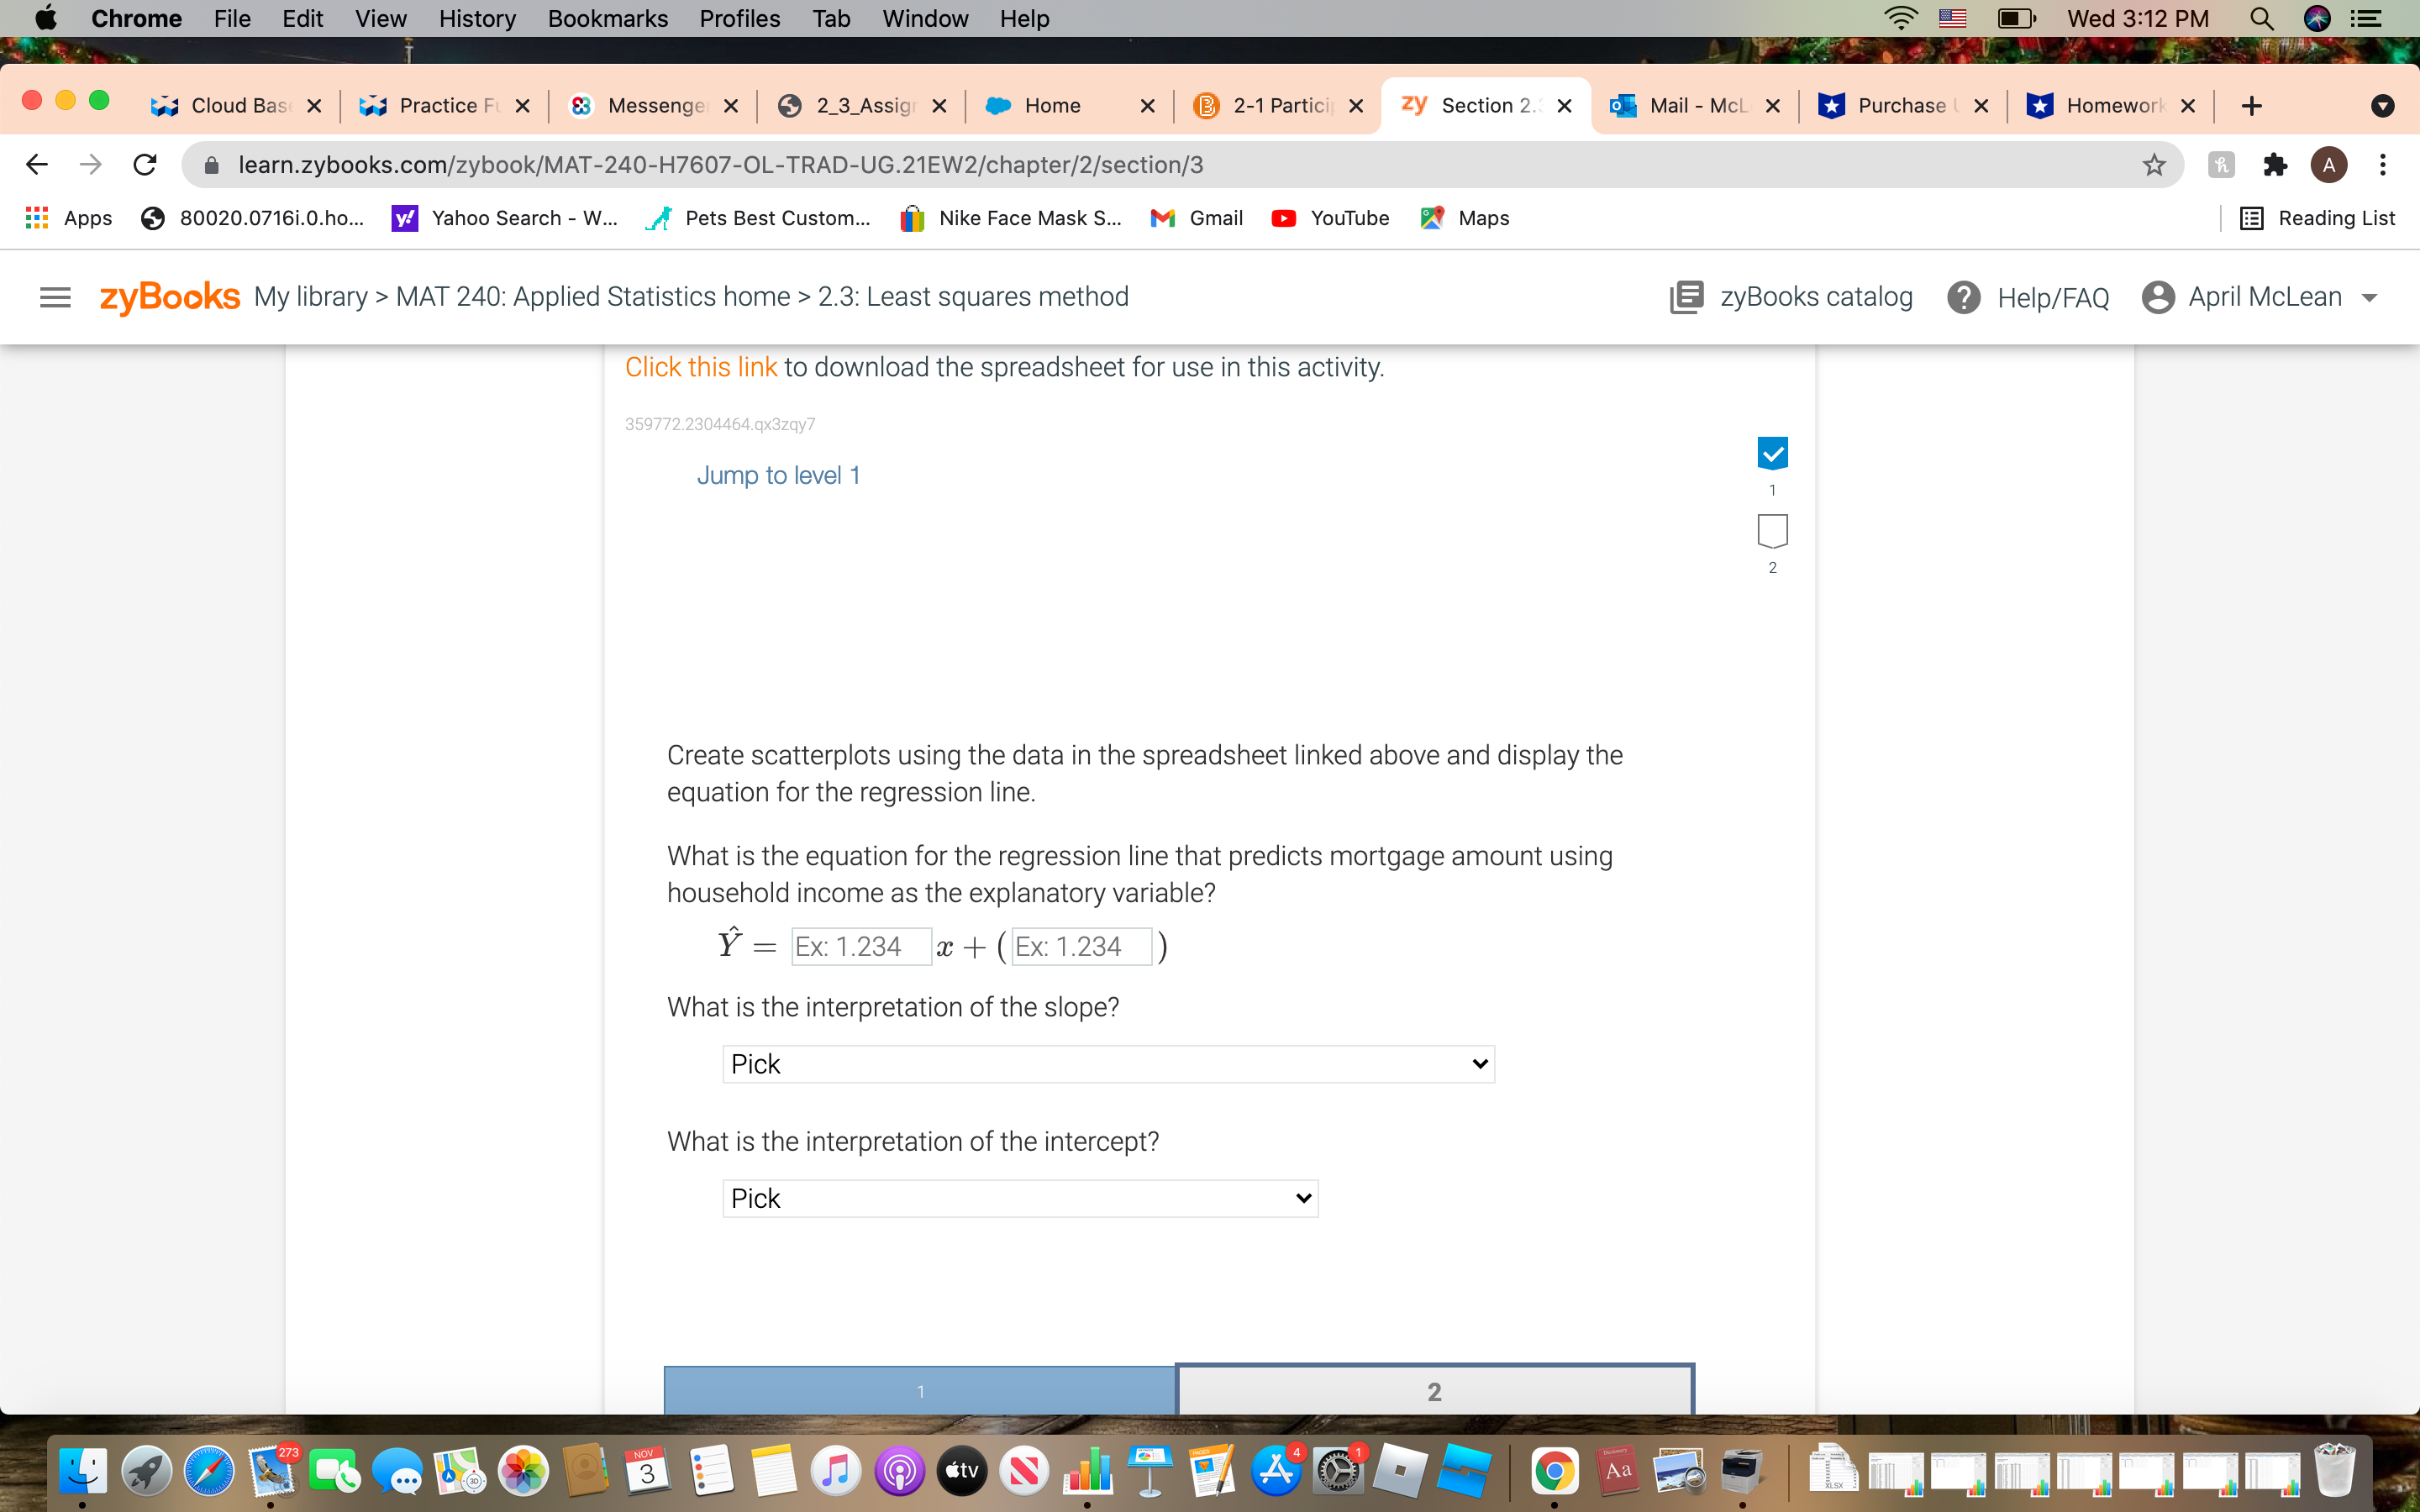
Chrome File Edit View History Bookmarks Profiles Tab Window Help ED Wed 3:12 PM Q DE ... Cloud Bas X Practice Fi X & Messenger X 2_3_Assign X Home x @ 2-1 Partici x zy Section 2. X 9Mail - McL X Purchase ( X Homework X + C learn.zybooks.com/zybook/MAT-240-H7607-OL-TRAD-UG.21EW2/chapter/2/section/3 A Apps 80020.07161.0.ho... y! Yahoo Search - W... Pets Best Custom... Nike Face Mask S... M Gmail Youtube Maps Reading List = zyBooks My library > MAT 240: Applied Statistics home > 2.3: Least squares method zyBooks catalog ? Help/FAQ April Mclean Click this link to download the spreadsheet for use in this activity. 359772.2304464.qx3zqy7 Jump to level 1 V N Create scatterplots using the data in the spreadsheet linked above and display the equation for the regression line. What is the equation for the regression line that predicts mortgage amount using household income as the explanatory variable? Y = Ex: 1.234 a + (Ex: 1.234 ) What is the interpretation of the slope? Pick What is the interpretation of the intercept? Pick 2 3 Aa
Step by Step Solution
There are 3 Steps involved in it

Get step-by-step solutions from verified subject matter experts