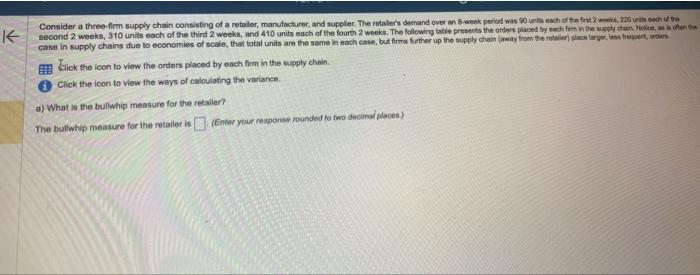
Question: Cick the icon to view the orders placed by noch fim in the supply chain. Clek the keen to view the ways of calculating the

Cick the icon to view the orders placed by noch
Cick the icon to view the orders placed by noch fim in the supply chain. Clek the keen to view the ways of calculating the variance. a) What is the bulketip measure fot the retailen The bulwhip measure for the rutaler is (Enter your response munded to two decinal places) ain consisting of a retailer, manufacturer, and supplier. The retailer's demand over an 8-w 1 of the third 2 weeks, and 410 units each of the fourth 2 weeks. The following table prese onomies of scale, that total units are the same in each case, but firms further up the supp. More Info More Info Recall that the sample variance of a data set can be found by using the VAR.S function in Excel or by plugging each value x of the data set into the formula: Variance =(n1)(xx)2 where x is the mean of the data set and n is the number of values in the set. telick the icon to view the orders placed by each firm in the supply clain. Click the leon to view the ways of calculating the variance. a) What it the bullwhip mennure for the retailer? The bulfwilip measure for the retailer is

Step by Step Solution

There are 3 Steps involved in it

1 Expert Approved Answer
Step: 1 Unlock blur-text-image
Question Has Been Solved by an Expert!

Get step-by-step solutions from verified subject matter experts

Step: 2 Unlock
Step: 3 Unlock

Students Have Also Explored These Related General Management Questions!