

Question: Citrix Receiver x |Topic: Week 7: Distribution and t x Topic: Week 7: Regression * *Course Hero x zy Section 7.8 - MATH 221: Statistic
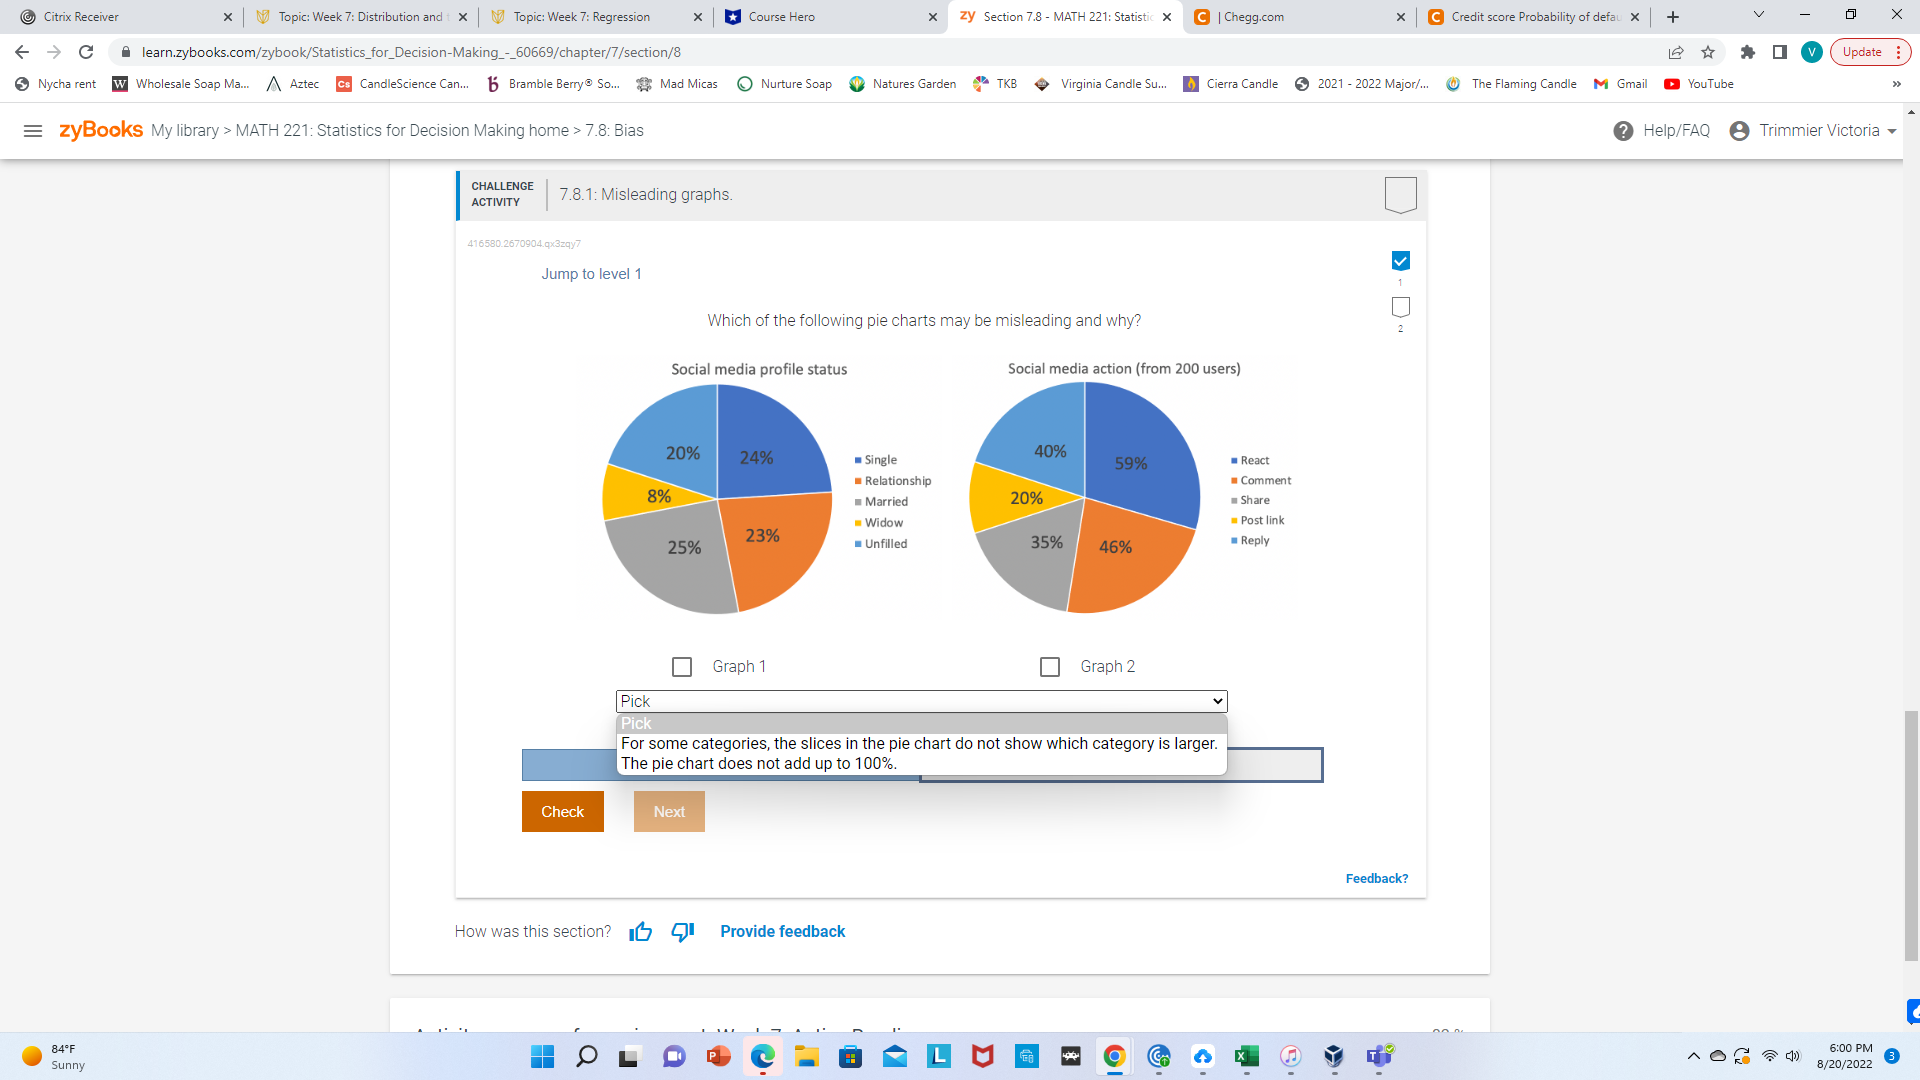
Citrix Receiver x |Topic: Week 7: Distribution and t x Topic: Week 7: Regression * *Course Hero x zy Section 7.8 - MATH 221: Statistic X C | Chegg.com x | Credit score Probability of defay x | + X C A learn.zybooks.com/zybook/Statistics_for_Decision-Making_-_60669/chapter/7/section/8 Update : Nycha rent w Wholesale Soap Ma.. A Aztec c CandleScience Can.. b Bramble Berry So.. Mad Micas Nurture Soap @ Natures Garden TKB @ Virginia Candle Su... | Cierra Candle 2021 - 2022 Major/.. @ The Flaming Candle M Gmail YouTube = zyBooks My library > MATH 221: Statistics for Decision Making home > 7.8: Bias Help/FAQ & Trimmier Victoria CHALLENGE ACTIVITY 7.8.1: Misleading graphs. 416580.2670904.qx3zay7 Jump to level 1 Which of the following pie charts may be misleading and why? Social media profile status Social media action (from 200 users) 20% 24% 40% 59% React Relationship Comment 8% Married 20% Share - Widow Post link 23% 25% Unfilled 35% 46% Reply Graph 1 Graph 2 Pick Pick For some categories, the slices in the pie chart do not show which category is larger. The pie chart does not add up to 100%. Check Next Feedback? How was this section? I Q! Provide feedback 84 F 6:00 PM Sunny 8/20/2022
Step by Step Solution
There are 3 Steps involved in it

Get step-by-step solutions from verified subject matter experts