

Question: Class Activity 1 Data from the World Health Organization represents countries in terms of poverty and life expectancy in the following table. Percentage of Country
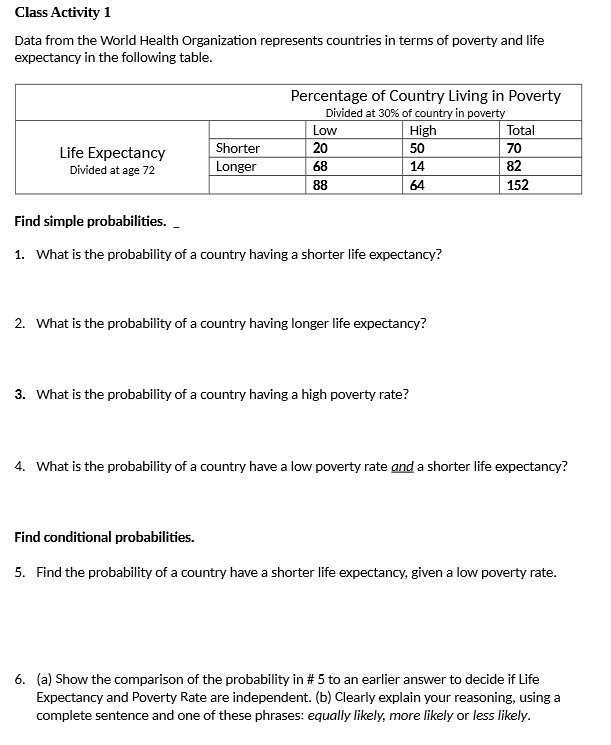
Class Activity 1 Data from the World Health Organization represents countries in terms of poverty and life expectancy in the following table. Percentage of Country Living in Poverty Divided at 30% of country in poverty Low High Total Life Expectancy Shorter 20 50 70 Divided at age 72 Longer 68 14 82 88 64 152 Find simple probabilities. 1. What is the probability of a country having a shorter life expectancy? 2. What is the probability of a country having longer life expectancy? 3. What is the probability of a country having a high poverty rate? 4. What is the probability of a country have a low poverty rate and a shorter life expectancy? Find conditional probabilities. 5. Find the probability of a country have a shorter life expectancy, given a low poverty rate. 6. (a) Show the comparison of the probability in # 5 to an earlier answer to decide if Life Expectancy and Poverty Rate are independent. (b) Clearly explain your reasoning, using a complete sentence and one of these phrases: equally likely, more likely or less likely
Step by Step Solution
There are 3 Steps involved in it

Get step-by-step solutions from verified subject matter experts