

Question: Class Activity: Performance estimation and ROC In a binary classification problem, we have a data set with 2 0 0 positive and 3 0 0
Class Activity: Performance estimation and ROC
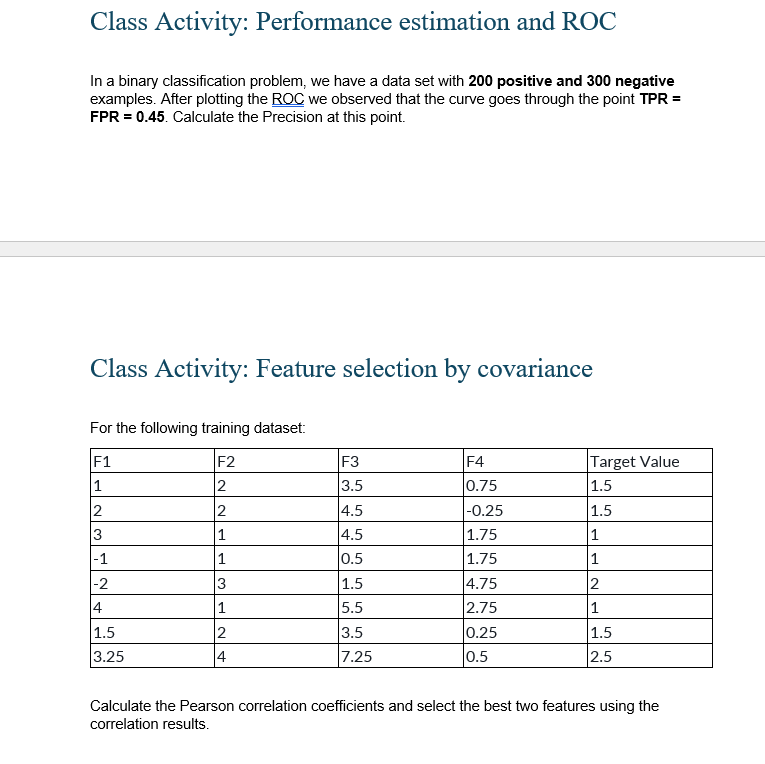
In a binary classification problem, we have a data set with positive and negative examples. After plotting the ROC we observed that the curve goes through the point FPR Calculate the Precision at this point.
Class Activity: Feature selection by covariance
For the following training dataset:
tableFFFFTarget Value
Calculate the Pearson correlation coefficients and select the best two features using the correlation results.
Step by Step Solution
There are 3 Steps involved in it
1 Expert Approved Answer
Step: 1 Unlock

Question Has Been Solved by an Expert!
Get step-by-step solutions from verified subject matter experts
Step: 2 Unlock
Step: 3 Unlock