

Question: Class Lab Book Section 8 . 1 Chap 8 HW 1 2 . Refer to the table of sample values in Section 8 . 2
Class
Lab
Book
Section
Chap HW
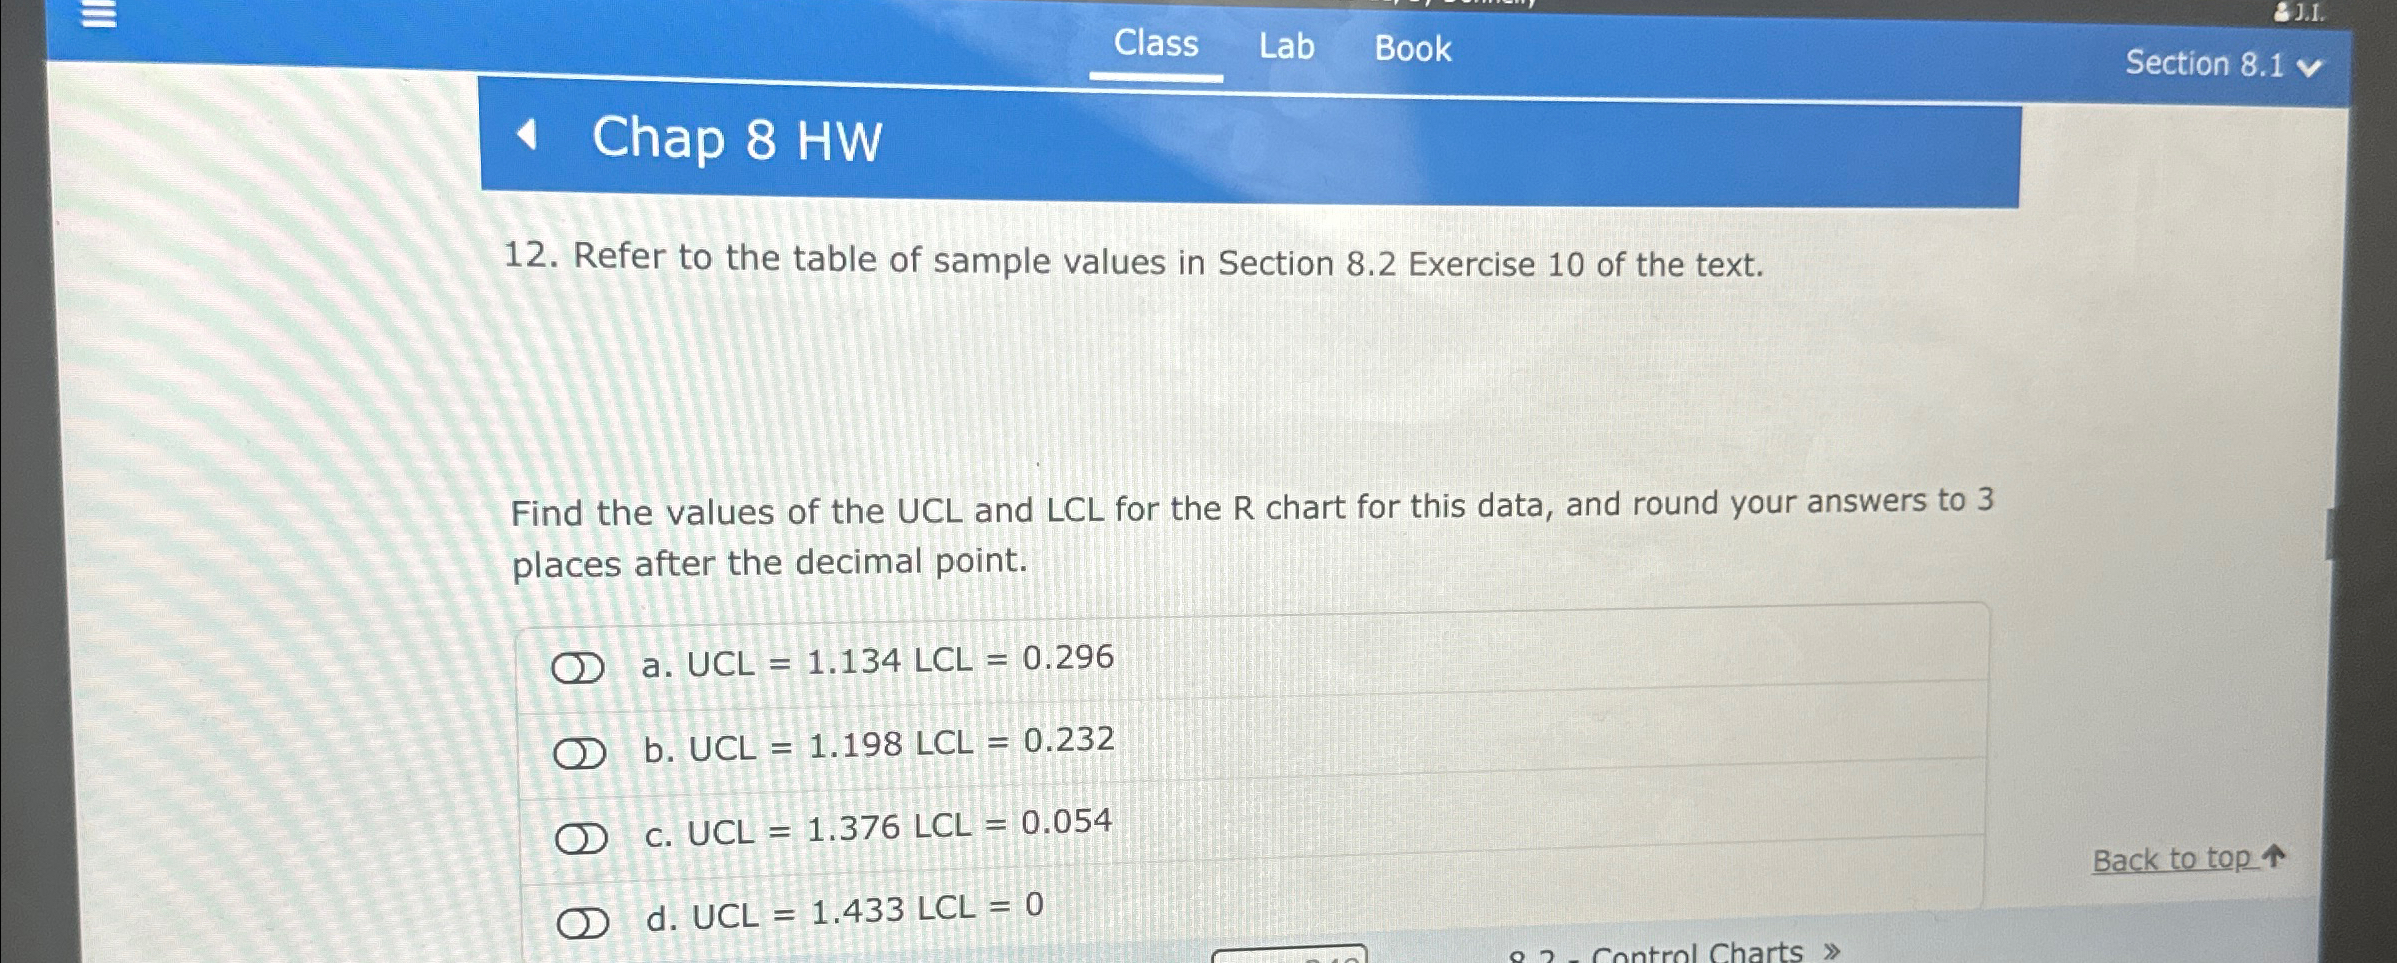
Refer to the table of sample values in Section Exercise of the text.
Find the values of the UCL and LCL for the R chart for this data, and round your answers to places after the decimal point.
a UCL
b UCL
c UCL
d UCL
Back to top
Step by Step Solution
There are 3 Steps involved in it
1 Expert Approved Answer
Step: 1 Unlock

Question Has Been Solved by an Expert!
Get step-by-step solutions from verified subject matter experts
Step: 2 Unlock
Step: 3 Unlock