

Question: Classify each cost item as fixed, variable, or semi-variable. Explain your classification. Prestige Data in table form Revenue Hours January February March Intercompany 206 181
- Classify each cost item as fixed, variable, or semi-variable. Explain your classification.
| Revenue Hours | January | February | March |
| Intercompany | 206 | 181 | 223 |
| Commercial | 123 | 135 | 138 |
| Total revenue hours | 329 | 316 | 361 |
| Service hours | 32 | 32 | 40 |
| Available hours | 223 | 164 | 143 |
| Total hours | 584 | 512 | 544 |
| January | February | March | |
| Revenues | |||
| Intercompany sales | $82,400 | $72,400 | $89,200 |
| Commercial sales | |||
| Computer use | 98,400 | 108,000 | 110,400 |
| Other | 9,241 | 9,184 | 12,685 |
| Total revenue | $190,041 | $189,584 | $212,285 |
| Expenses | |||
| Space costs: | |||
| Rent | $8,000 | $8,000 | $8,000 |
| Custodial services | 1,240 | 1,240 | 1,240 |
| Total | 9,240 | 9,240 | 9,240 |
| Equipment costs | |||
| Computer leases | 95,000 | 95,000 | 95,000 |
| Maintenance | 5,400 | 5,400 | 5,400 |
| Depreciation: | |||
| Computer equipment | 25,500 | 25,500 | 25,500 |
| Office equipment and fixtures | 680 | 680 | 680 |
| Power | 1,633 | 1,592 | 1,803 |
| Total | 128,213 | 128,172 | 128,383 |
| Wages and salaries | |||
| Operations | 29,496 | 29,184 | 30,264 |
| Systems development and maintenance | 12,000 | 12,000 | 12,000 |
| Administration | 9,000 | 9,000 | 9,000 |
| Sales | 11,200 | 11,200 | 11,200 |
| Total | 61,696 | 61,384 | 62,464 |
| Materials | 9,031 | 8,731 | 10,317 |
| Sales promotions | 7,909 | 7,039 | 8,083 |
| Corporate services | 15,424 | 15,359 | 15,236 |
| Total expenses | $231,513 | $229,925 | $233,723 |
| Net income (loss) | ($41,472) | ($40,341) | ($21,438) |
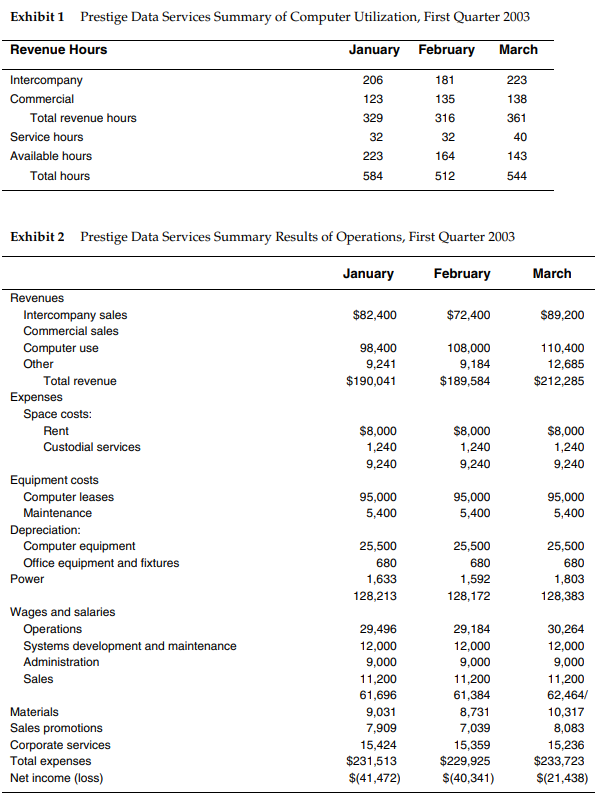
Exhibit 1 Prestige Data Services Summary of Computer Utilization, First Quarter 2003 Revenue Hours January February March 223 138 Intercompany Commercial Total revenue hours Service hours Available hours Total hours 206 123 329 32 223 584 181 135 316 32 361 40 143 164 512 544 Exhibit 2 Prestige Data Services Summary Results of Operations, First Quarter 2003 January February March $82,400 $72,400 $89,200 Revenues Intercompany sales Commercial sales Computer use Other Total revenue Expenses Space costs: Rent Custodial services 98,400 9,241 $190,041 108,000 9,184 $189,584 110,400 12,685 $212,285 $8,000 1,240 9,240 $8,000 1,240 9,240 $8,000 1,240 9,240 95,000 5,400 95,000 5,400 95,000 5,400 Equipment costs Computer leases Maintenance Depreciation: Computer equipment Office equipment and fixtures Power 25,500 680 1,633 128,213 25,500 680 1,592 128,172 25,500 680 1,803 128,383 Wages and salaries Operations Systems development and maintenance Administration Sales Materials Sales promotions Corporate services Total expenses Net income (loss) 29,496 12,000 9,000 11,200 61,696 9,031 7,909 15,424 $231,513 $(41,472) 29,184 12,000 9,000 11,200 61,384 8,731 7,039 15,359 $229,925 $(40,341) 30,264 12,000 9,000 11,200 62,464/ 10,317 8,083 15,236 $233,723 $(21,438)
Step by Step Solution
There are 3 Steps involved in it

Get step-by-step solutions from verified subject matter experts