

Question: Classify the following data. Indicate whether the data is qualitative or quantitative, indicate whether the data is discrete, continuous, or neither, and indicate the level
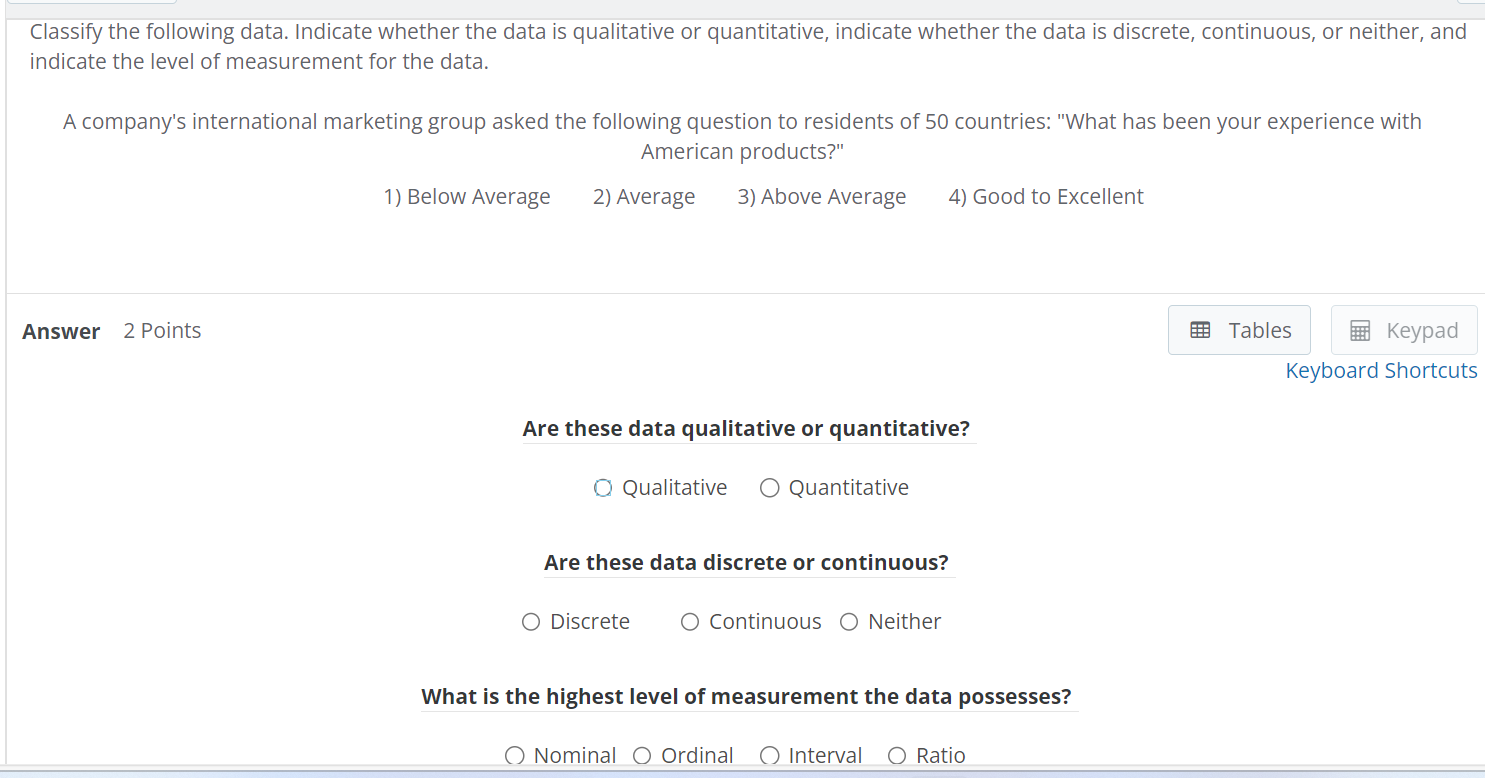
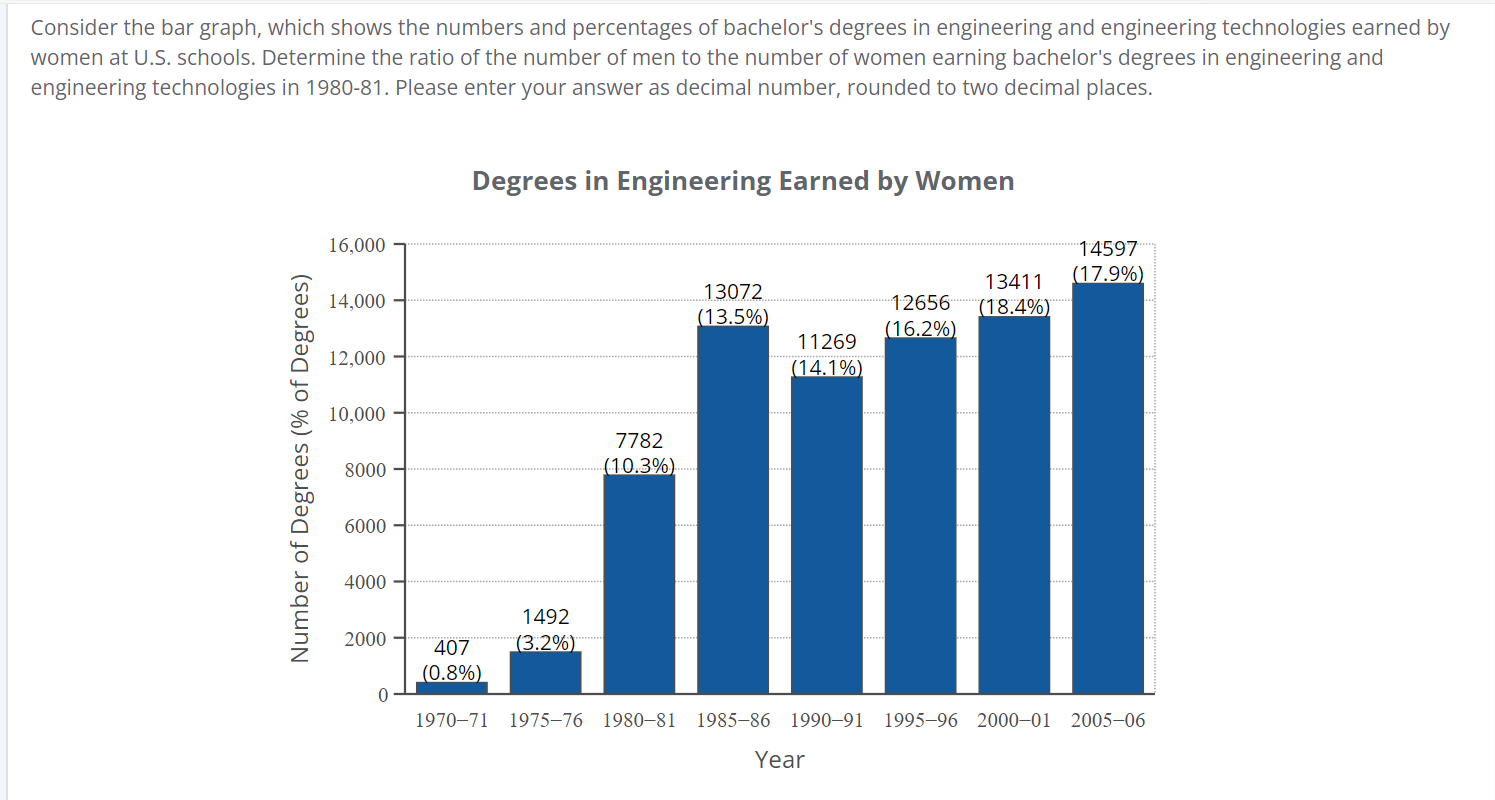
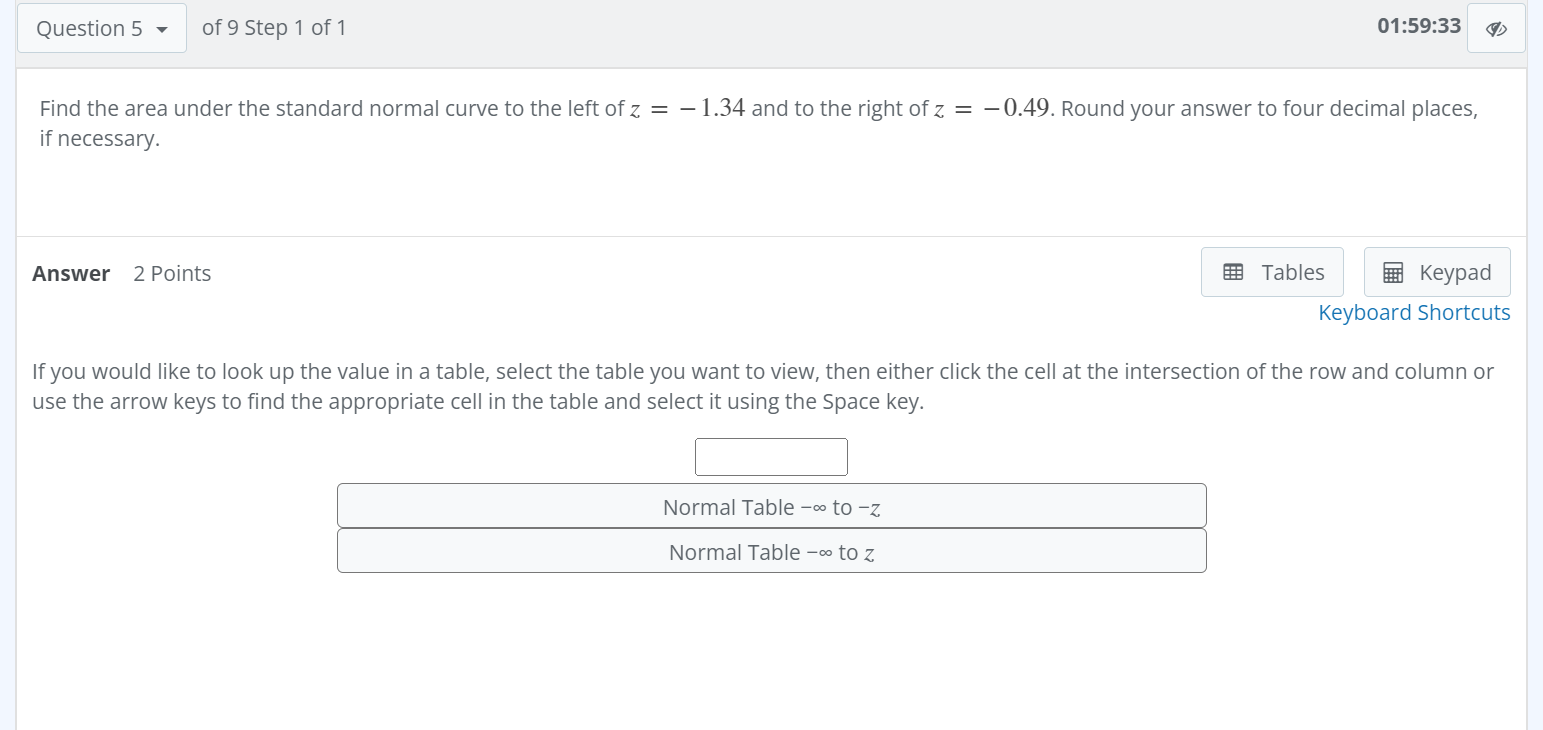
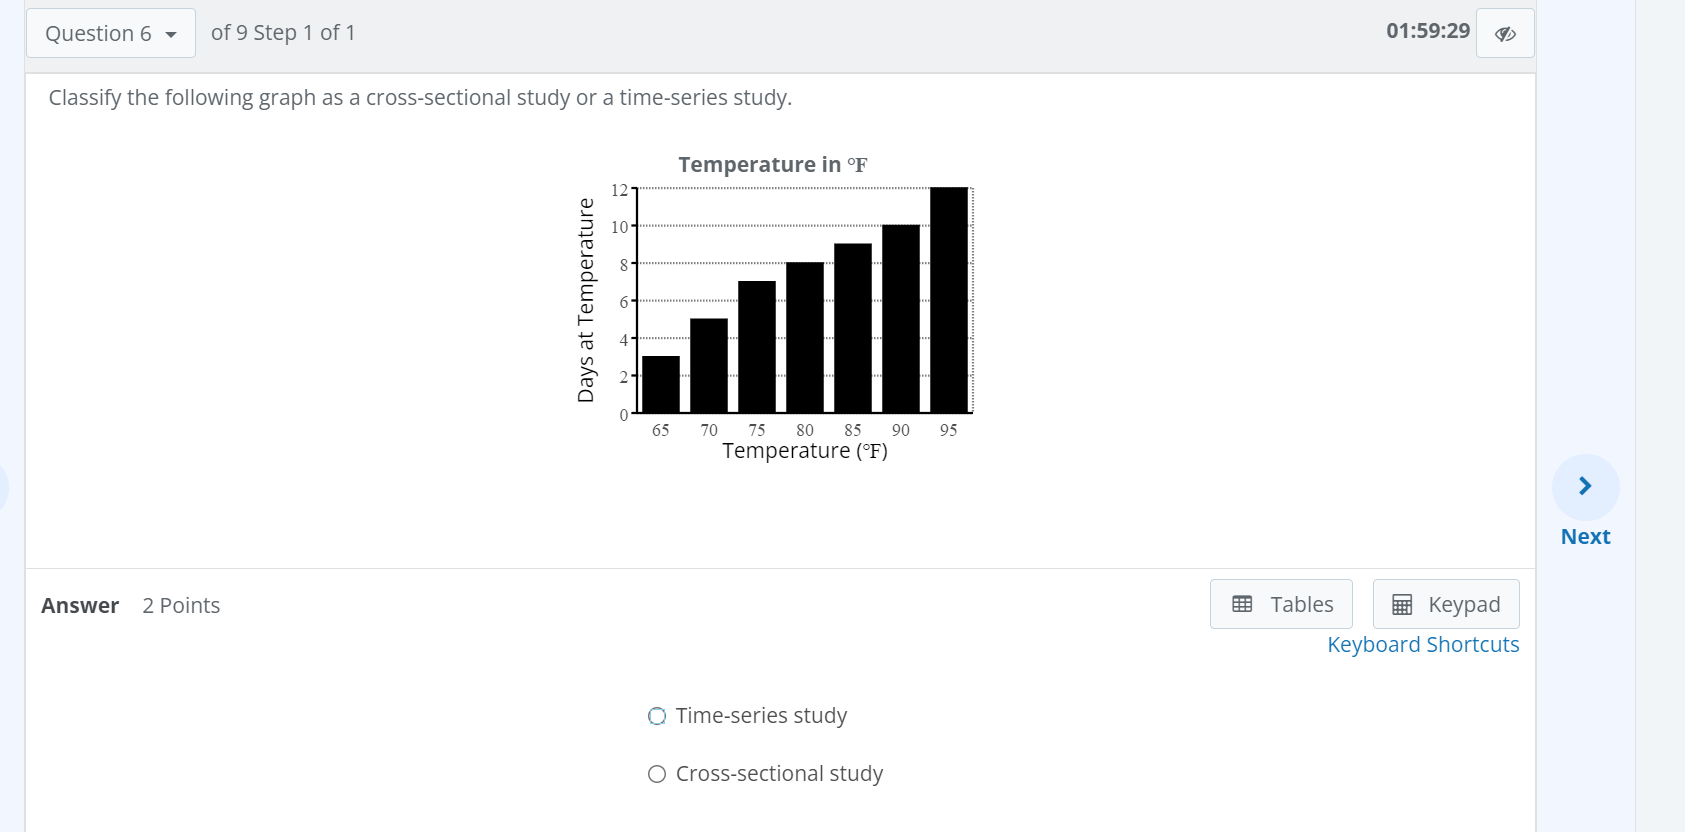

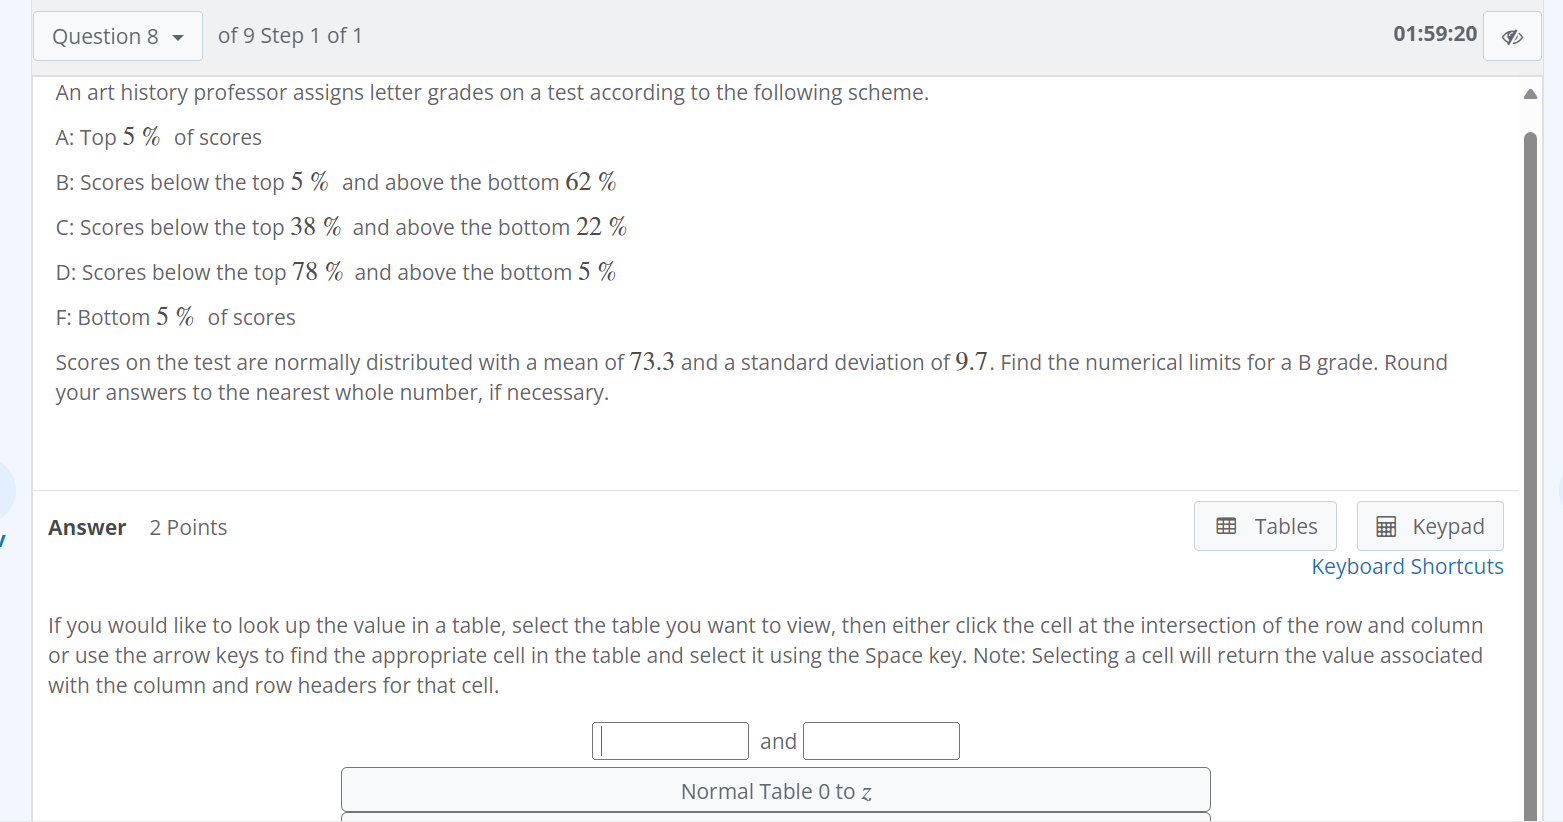
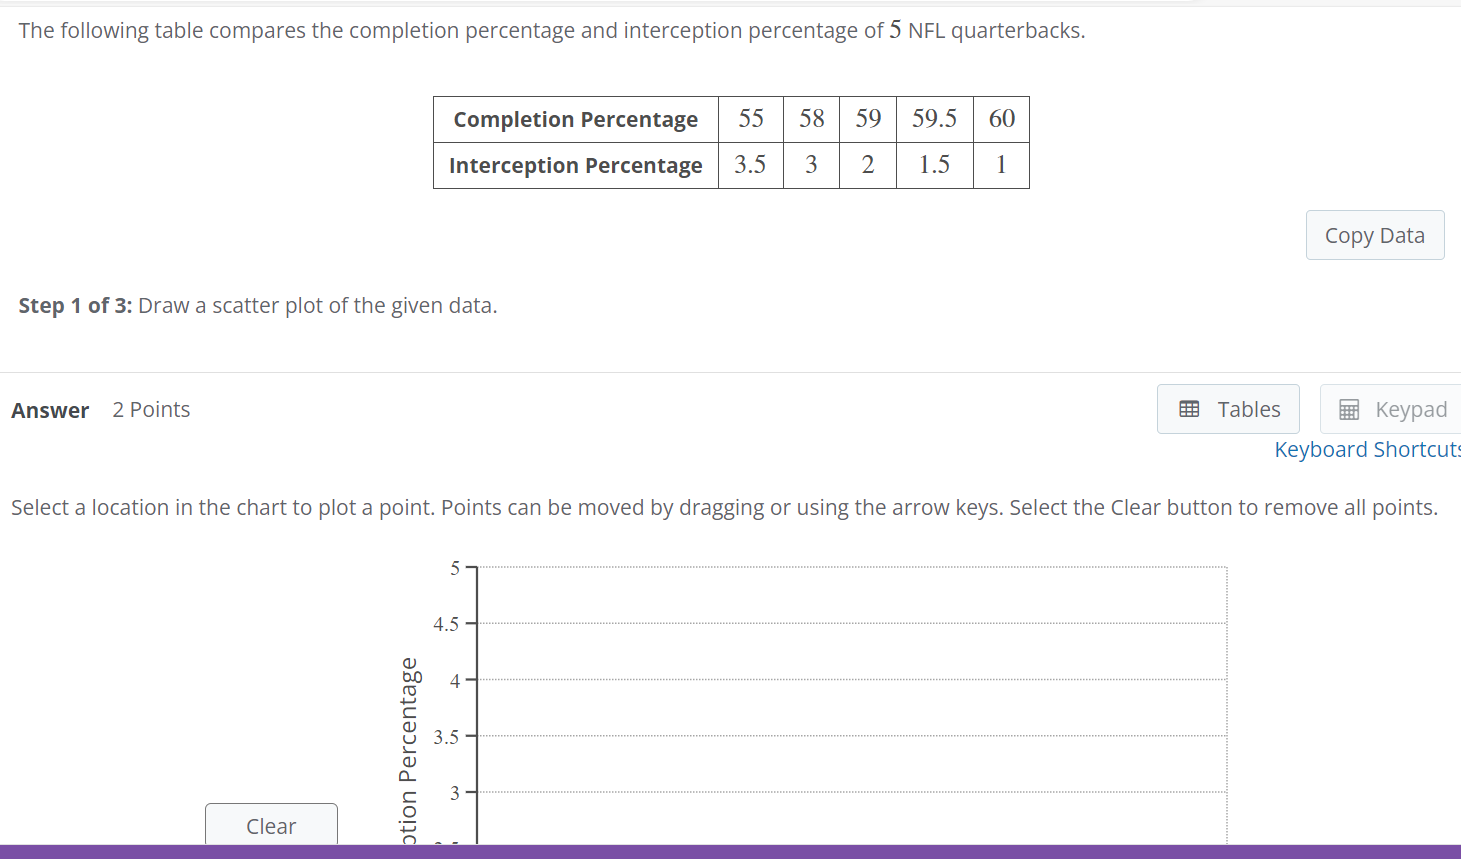
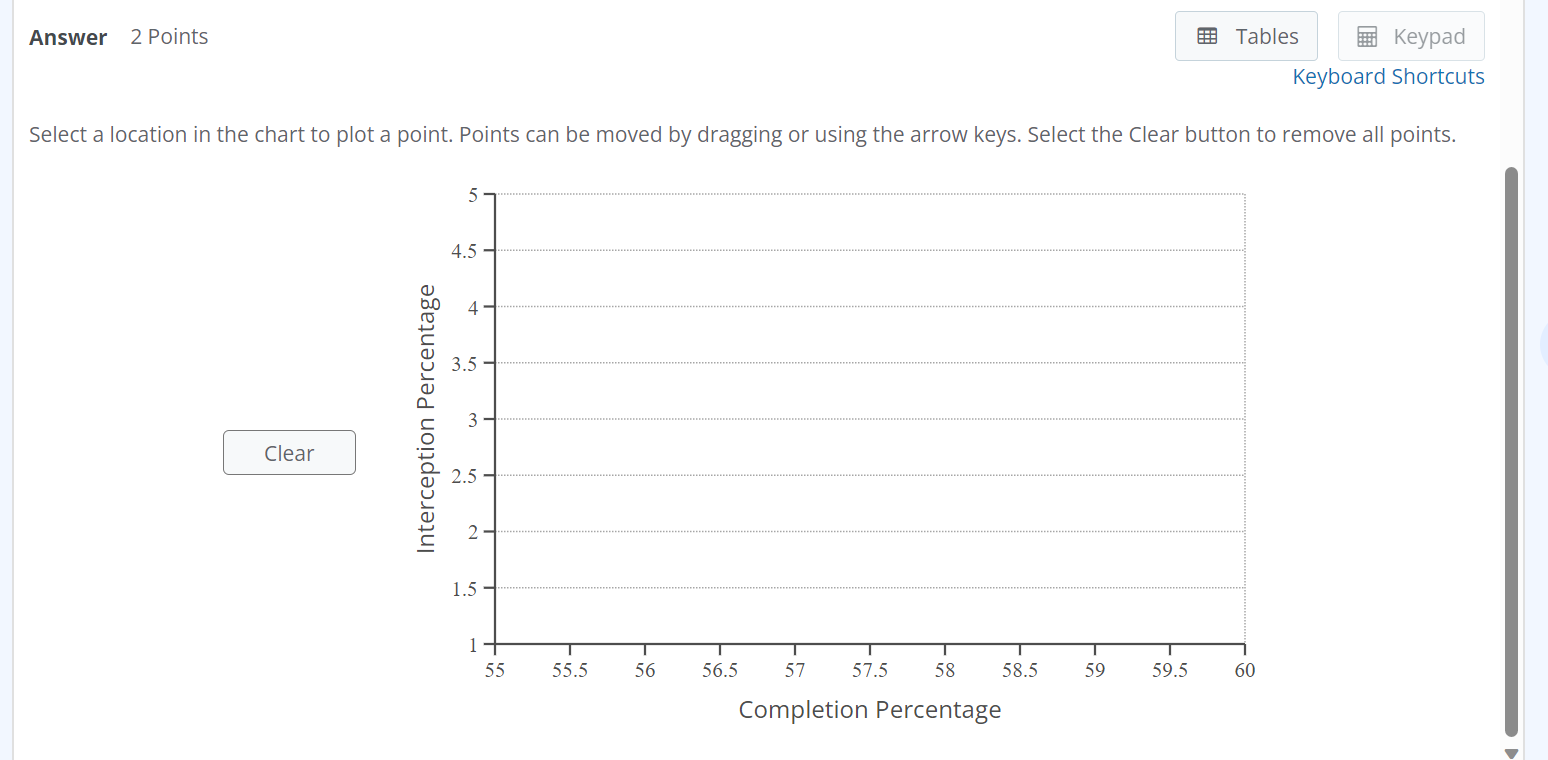
Classify the following data. Indicate whether the data is qualitative or quantitative, indicate whether the data is discrete, continuous, or neither, and indicate the level of measurement for the data. A company's international marketing group asked the following question to residents of 50 countries: "What has been your experience with American products?\" 1) Below Average 2) Average 3) Above Average 4) Good to Excellent Answer 2 Points B8 Tables B Keypad Keyboard Shortcuts Are these data qualitative or quantitative? (O Qualitative O Quantitative Are these data discrete or continuous? QO Discrete O Continuous O Neither What is the highest level of measurement the data possesses? (O Nominal O Ordinal O Interval O Ratio Question2 ~ of 9 Step 1 of 1 01:59:47 @ The mean life of a television set is 135 months with a standard deviation of 18 months. If a sample of 98 televisions is randomly selected, what is the probability that the sample mean would differ from the true mean by greater than 3.4 months? Round your answer to four decimal places. AnswerHow to enter your answer (opens in new window) 2 Points B Tables = Keypad Keyboard Shortcuts Question3 ~ | of 9Step 1 of 1 01:59:44 @ The weights of newborn baby boys born at a local hospital are believed to have a normal distribution with a mean weight of 3338 grams and a variance of 85,849. If a newborn baby boy born at the local hospital is randomly selected, find the probability that the weight will be less than 3601 grams. Round your answer to four decimal places. Answer 2 Points B8 Tables B Keypad Keyboard Shortcuts If you would like to look up the value in a table, select the table you want to view, then either click the cell at the intersection of the row and column or use the arrow keys to find the appropriate cell in the table and select it using the Space key. L Normal Table e to = Normal Table e to = Consider the bar graph, which shows the numbers and percentages of bachelor's degrees in engineering and engineering technologies earned by women at U.S. schools. Determine the ratio of the number of men to the number of women earning bachelor's degrees in engineering and engineering technologies in 1980-81. Please enter your answer as decimal number, rounded to two decimal places. Number of Degrees (% of Degrees) Degrees in Engineering Earned by Women 16,000 14,000 12,000 10,000 8000 6000 4000 2000 1970-71 1975-76 1980-81 1985-86 1990-91 1995-96 2000-01 2005-06 Year Question5 v | of 9Step 1 of 1 01:59:33 @ Find the area under the standard normal curve to the left of z = 1.34 and to the right of z = 0.49. Round your answer to four decimal places, if necessary. Answer 2 Points B8 Tables Keypad Keyboard Shortcuts If you would like to look up the value in a table, select the table you want to view, then either click the cell at the intersection of the row and column or use the arrow keys to find the appropriate cell in the table and select it using the Space key. [ ] Normal Table - to -z Normal Table = to z Question 6 of 9 Step 1 of 1 01:59:29 Classify the following graph as a cross-sectional study or a time-series study. Temperature in OF 12- Days at Temperature 9 N 65 70 75 80 85 90 95 Temperature ( F) > Next Answer 2 Points Tables Keypad Keyboard Shortcuts Q Time-series study O Cross-sectional studyQuestion 7 v | of 9 Step 1 of 1 01:59:25 @ Three cards are drawn with replacement from a standard deck. What is the probability that the first card will be a spade, the second card will be a red card, and the third card will be a ten? Express your answer as a fraction or a decimal number rounded to four decimal places. AnswerHow to enter your answer (opens in new window) 2 Points B8 Tables Keypad Keyboard Shortcuts Next Question 8 ~ | of 9Step 1 of 1 01:59:20 @ An art history professor assigns letter grades on a test according to the following scheme. A:Top5 % of scores B: Scores below the top 5 % and above the bottom 62 % C: Scores below the top 38 % and above the bottom 22 % D: Scores below the top 78 % and above the bottom 5 % F: Bottom 5 % of scores Scores on the test are normally distributed with a mean of 73.3 and a standard deviation of 9.7. Find the numerical limits for a B grade. Round your answers to the nearest whole number, if necessary. Answer 2 Points B8 Tables fE Keypad Keyboard Shortcuts If you would like to look up the value in a table, select the table you want to view, then either click the cell at the intersection of the row and column or use the arrow keys to find the appropriate cell in the table and select it using the Space key. Note: Selecting a cell will return the value associated with the column and row headers for that cell. [ | and| | Normal Table 0 to z The following table compares the completion percentage and interception percentage of 5 NFL quarterbacks. Completion Percentage 55 58 59 59.5 60 Interception Percentage 1.5 Step 1 of 3: Draw a scatter plot of the given data. Answer 2 Points Copy Data B Keypad Keyboard Shortcut: Select a location in the chart to plot a point. Points can be moved by dragging or using the arrow keys. Select the Clear button to remove all points. 4.5 btion Percentage [9%) L Clear Answer 2 Points 88 Tables E Keypad Keyboard Shortcuts Select a location in the chart to plot a point. Points can be moved by dragging or using the arrow keys. Select the Clear button to remove all points. Clear Interception Percentage 55 55.5 56 56.5 57 57.5 58 585 59 59.5 60 Completion Percentage
Step by Step Solution
There are 3 Steps involved in it

Get step-by-step solutions from verified subject matter experts