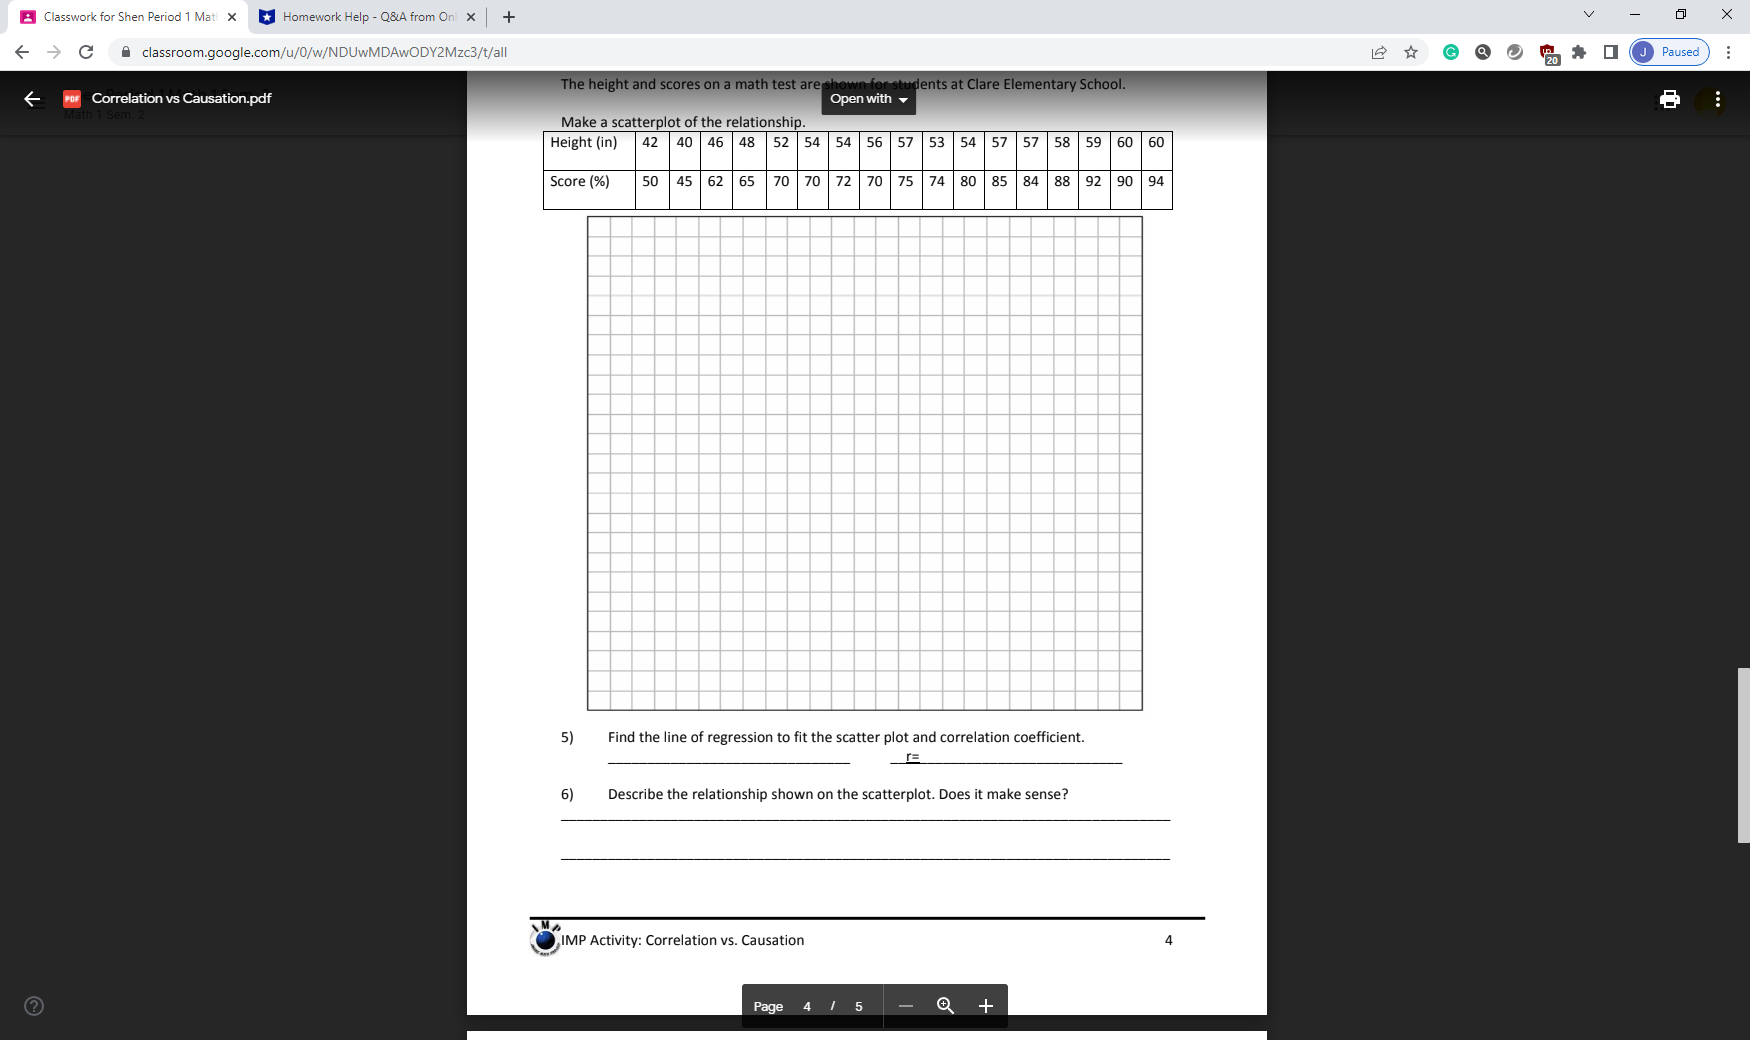
Question: Classwork for Shen Period 1 Mati X * Homework Help - Q&A from Onl x + X classroom.google.com/u/0/w/NDUwMDAWODY2Mzc3/t/all G QU HAJ Paused The height and

Classwork for Shen Period 1 Mati X * Homework
Classwork for Shen Period 1 Mati X * Homework Help - Q&A from Onl x + X classroom.google.com/u/0/w/NDUwMDAWODY2Mzc3/t/all G QU HAJ Paused The height and scores on a math test are she udents at Clare Elementary School. OF Correlation vs Causation.pdf Open with Make a scatterplot of the relationship. Height (in) 42 40 46 48 52 54 54 56 57 53 54 57 57 58 59 60 60 Score (%) 50 45 62 65 70 70 72 2 70 75 74 80 85 84 88 92 90 94 5) Find the line of regression to fit the scatter plot and correlation coefficient. 6) Describe the relationship shown on the scatterplot. Does it make sense? IMP Activity: Correlation vs. Causation ?) Page 1 5 +

Step by Step Solution

There are 3 Steps involved in it

1 Expert Approved Answer
Step: 1 Unlock blur-text-image
Question Has Been Solved by an Expert!

Get step-by-step solutions from verified subject matter experts

Step: 2 Unlock
Step: 3 Unlock

Students Have Also Explored These Related Mathematics Questions!