

Question: Clearly explanation in 7e and 6 based on the data 7. Outliers. Your professor is not a fan of deleting outliers at the EDA stage,
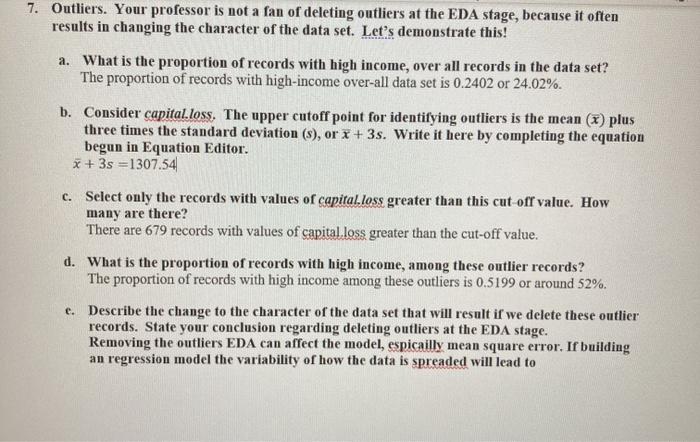
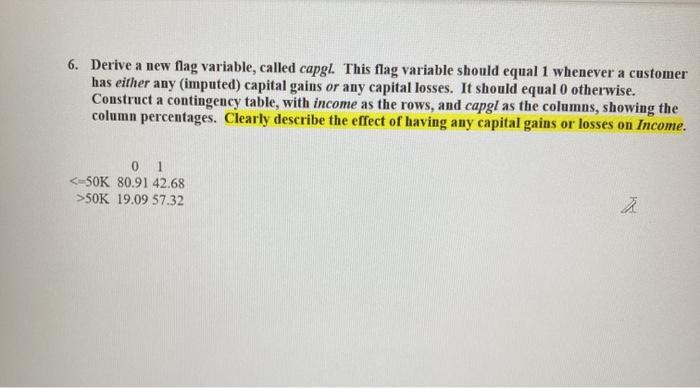
7. Outliers. Your professor is not a fan of deleting outliers at the EDA stage, because it often results in changing the character of the data set. Let's demonstrate this! a. What is the proportion of records with high income, over all records in the data set? The proportion of records with high-income over-all data set is 0.2402 or 24.02%. b. Consider capital.loss. The upper cutoff point for identifying outliers is the mean (x) plus three times the standard deviation (s), or x + 3s. Write it here by completing the equation begun in Equation Editor. * +3s = 1307.54 c. Select only the records with values of capital.loss greater than this cut off value. How many are there? There are 679 records with values of capital.loss greater than the cut-off value. d. What is the proportion of records with high income, among these outlier records? The proportion of records with high income among these outliers is 0.5199 or around 52%. e. Describe the change to the character of the data set that will result if we delete these outlier records. State your conclusion regarding deleting outliers at the EDA stage. Removing the outliers EDA can affect the model, espicailly mean square error. If building an regression model the variability of how the data is spreaded will lead to 6. Derive a new flag variable, called capgl. This flag variable should equal 1 whenever a customer has either any imputed) capital gains or any capital losses. It should equal O otherwise. Construct a contingency table, with income as the rows, and capgl as the columns, showing the column percentages. Clearly describe the effect of having any capital gains or losses on Income. 0 1 50K 19.09 57.32 7. Outliers. Your professor is not a fan of deleting outliers at the EDA stage, because it often results in changing the character of the data set. Let's demonstrate this! a. What is the proportion of records with high income, over all records in the data set? The proportion of records with high-income over-all data set is 0.2402 or 24.02%. b. Consider capital.loss. The upper cutoff point for identifying outliers is the mean (x) plus three times the standard deviation (s), or x + 3s. Write it here by completing the equation begun in Equation Editor. * +3s = 1307.54 c. Select only the records with values of capital.loss greater than this cut off value. How many are there? There are 679 records with values of capital.loss greater than the cut-off value. d. What is the proportion of records with high income, among these outlier records? The proportion of records with high income among these outliers is 0.5199 or around 52%. e. Describe the change to the character of the data set that will result if we delete these outlier records. State your conclusion regarding deleting outliers at the EDA stage. Removing the outliers EDA can affect the model, espicailly mean square error. If building an regression model the variability of how the data is spreaded will lead to 6. Derive a new flag variable, called capgl. This flag variable should equal 1 whenever a customer has either any imputed) capital gains or any capital losses. It should equal O otherwise. Construct a contingency table, with income as the rows, and capgl as the columns, showing the column percentages. Clearly describe the effect of having any capital gains or losses on Income. 0 1 50K 19.09 57.32
Step by Step Solution
There are 3 Steps involved in it

Get step-by-step solutions from verified subject matter experts