

Question: Clearly label all graphical elements and changes in your graphs. 1. Suppose the demand for kringle is elastic and the supply of kringle is inelastic
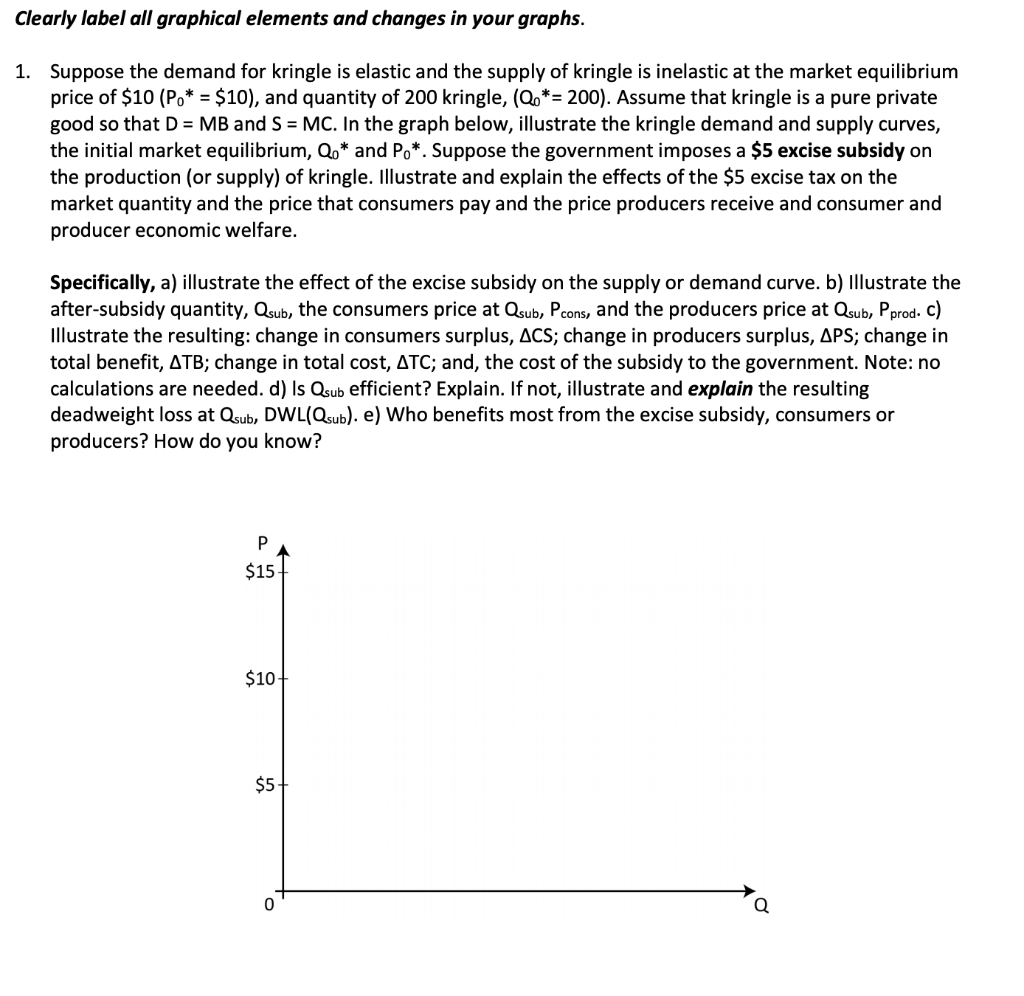
Clearly label all graphical elements and changes in your graphs. 1. Suppose the demand for kringle is elastic and the supply of kringle is inelastic at the market equilibrium price of $10 (Po* = $10), and quantity of 200 kringle, (Q.*= 200). Assume that kringle is a pure private good so that D = MB and S = MC. In the graph below, illustrate the kringle demand and supply curves, the initial market equilibrium, Qo* and Po*. Suppose the government imposes a $5 excise subsidy on the production (or supply) of kringle. Illustrate and explain the effects of the $5 excise tax on the market quantity and the price that consumers pay and the price producers receive and consumer and producer economic welfare. Specifically, a) illustrate the effect of the excise subsidy on the supply or demand curve. b) illustrate the after-subsidy quantity, Qsub, the consumers price at Qsub, Pcons, and the producers price at Qsub, Pprod. c) Illustrate the resulting: change in consumers surplus, ACS; change in producers surplus, APS; change in total benefit, ATB; change in total cost, ATC; and, the cost of the subsidy to the government. Note: no calculations are needed. d) Is Qsub efficient? Explain. If not, illustrate and explain the resulting deadweight loss at Qoub, DWL(Qsub). e) Who benefits most from the excise subsidy, consumers or producers? How do you know? P $15 $10+ $5 0 Clearly label all graphical elements and changes in your graphs. 1. Suppose the demand for kringle is elastic and the supply of kringle is inelastic at the market equilibrium price of $10 (Po* = $10), and quantity of 200 kringle, (Q.*= 200). Assume that kringle is a pure private good so that D = MB and S = MC. In the graph below, illustrate the kringle demand and supply curves, the initial market equilibrium, Qo* and Po*. Suppose the government imposes a $5 excise subsidy on the production (or supply) of kringle. Illustrate and explain the effects of the $5 excise tax on the market quantity and the price that consumers pay and the price producers receive and consumer and producer economic welfare. Specifically, a) illustrate the effect of the excise subsidy on the supply or demand curve. b) illustrate the after-subsidy quantity, Qsub, the consumers price at Qsub, Pcons, and the producers price at Qsub, Pprod. c) Illustrate the resulting: change in consumers surplus, ACS; change in producers surplus, APS; change in total benefit, ATB; change in total cost, ATC; and, the cost of the subsidy to the government. Note: no calculations are needed. d) Is Qsub efficient? Explain. If not, illustrate and explain the resulting deadweight loss at Qoub, DWL(Qsub). e) Who benefits most from the excise subsidy, consumers or producers? How do you know? P $15 $10+ $5 0
Step by Step Solution
There are 3 Steps involved in it

Get step-by-step solutions from verified subject matter experts